Using fractals and drawing support resistance
-
I have successfully managed to re-draw my SR lines when each new fractal is formed, but...
My trading strategy is to look for small pullbacks after a breakout of either a) a period of consolidation or b) the break of a previous major swing level.
I thought fractals would be a good tool for this. But what I've got actually is lines re-drawing too frequently at every minor pivot/swing level, so if my logic is to enter only when resistance is broken, it kinda never gets the signal coz there's always new resistance/fractals forming.
I think it's difficult to define what a breakout/break of structure would look like. When I trade manually I can just see/feel it and at the moment that is what I am doing, I have a semi-automatic EA.
Anyone got any ideas on how to resolve?
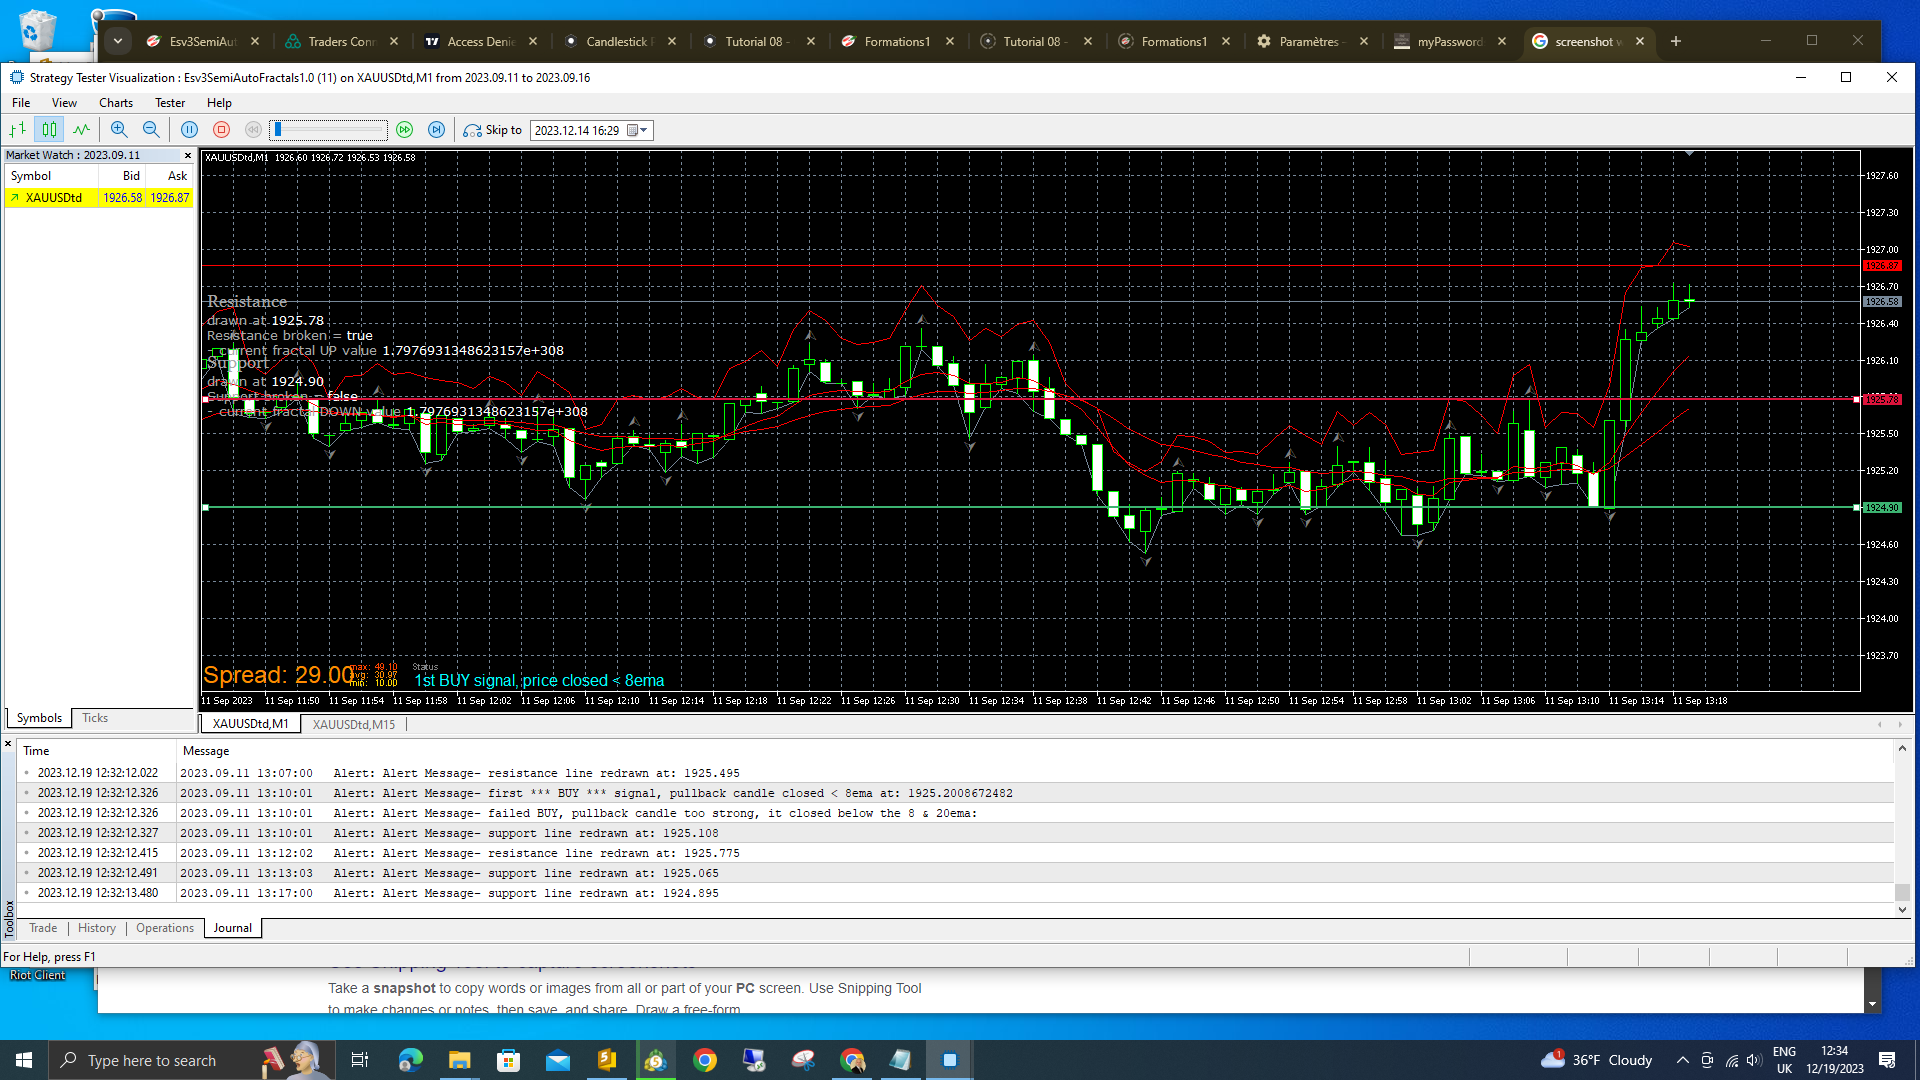
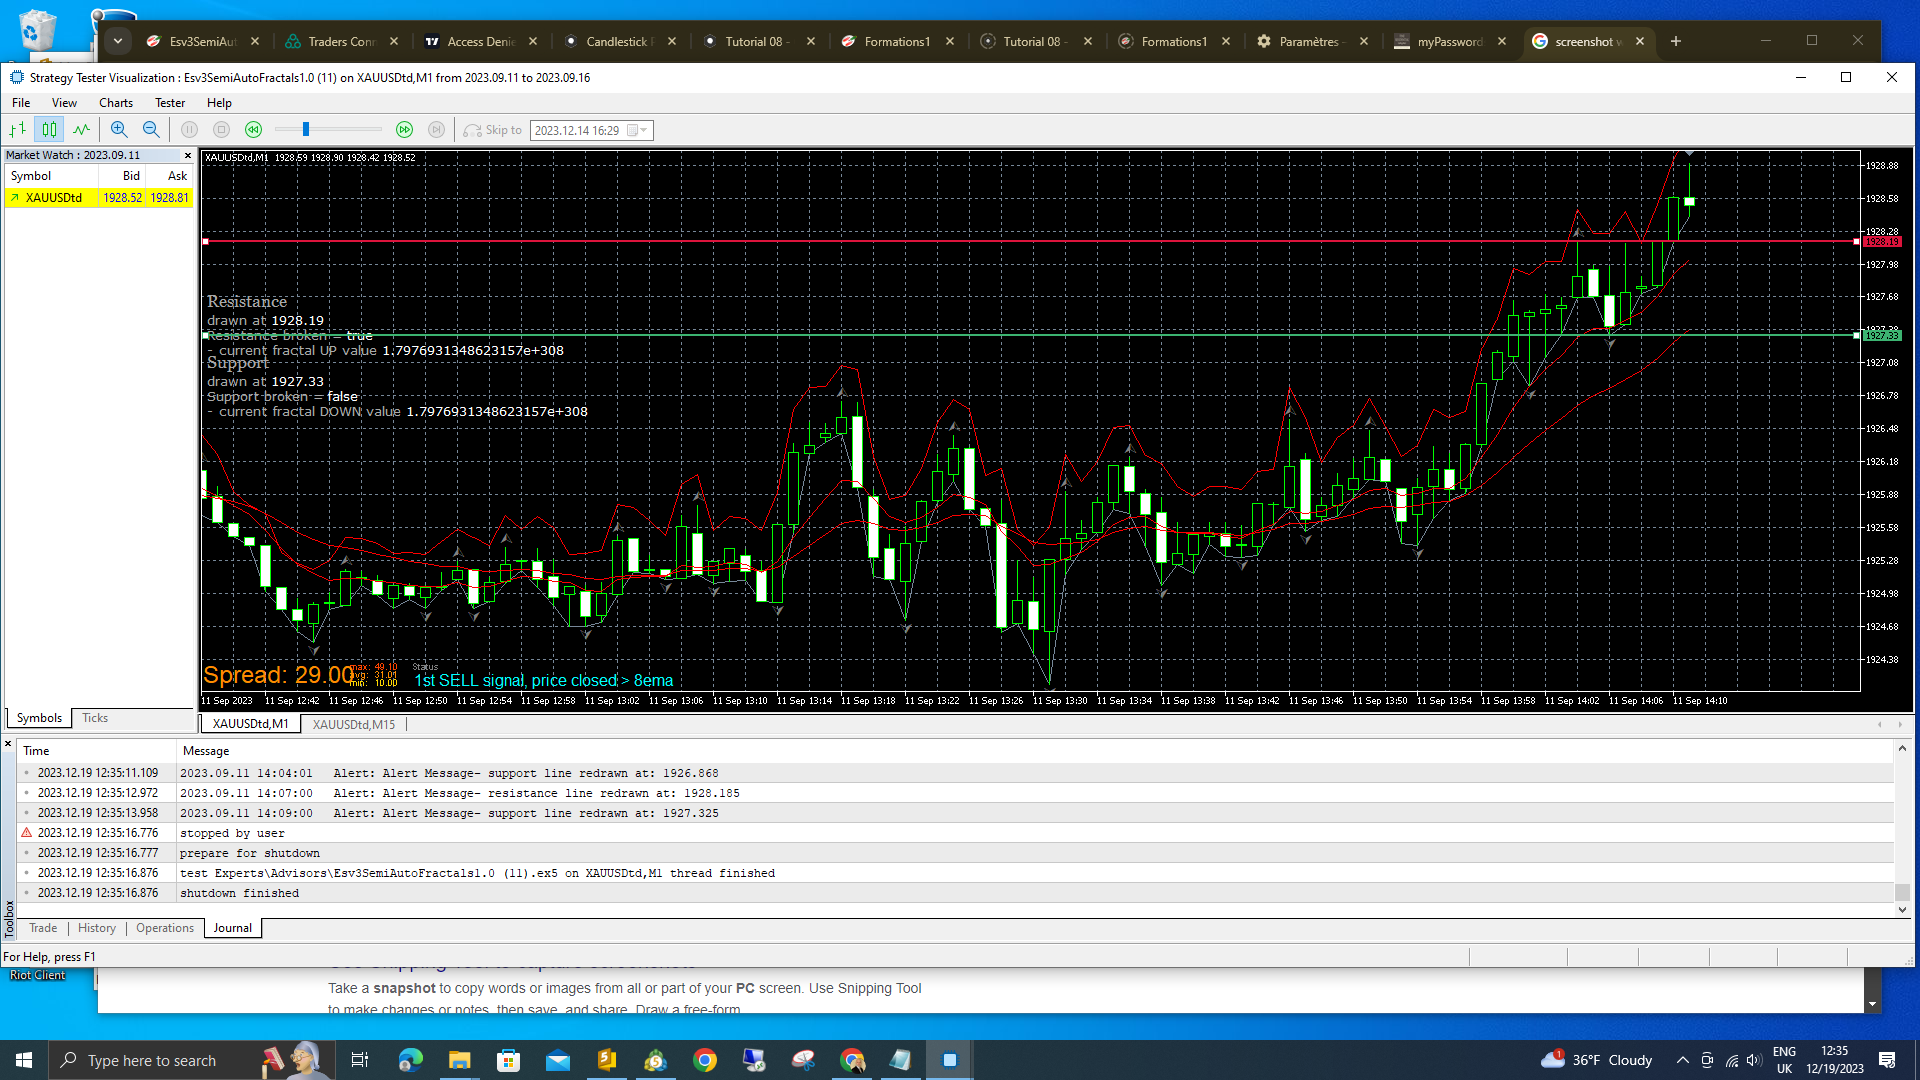
See screenshots for the kinda idea... the first image shows SR lines nicely set up, but in the 2nd image you'll see the lines have followed upwards and I lose the signal for those 2 little bear bars.
sorry image uplaod was error... trying...
-
images
-
You are requesting the Holy Grial, my friend!
 That's not easy to do. Unless you select a solid, hard tested set of conditions to define what a SR is, the easier solution would be selecting a custom indicator doing it for you.
 -
Hee hee :} Good to hear. I will play with ADX maybe, also could just define my own range, say highs and lows of last 20 candles and use that. For the time being I am using my EA semi-automatically, already a massive improvement on my pre-fxDreema days
")
-
Hola, puedes compartir el enlace de como dibujas los soportes y resistencias amigo?