Trend Drawdown in a given period
-
I am trying to show Trend draw down on a chart.
First I look at the chart and determine the trend direction.
Note, am only looking at the last 200 bars on the right side of the chart.
If price of candle ID 1 is greater than price of candle ID 200 then trend is up, if candle 1 is less than 200 then trend is down.
Now looking at the chat below the trend is up and there is a bit of drawdown indicated by the blue line.
(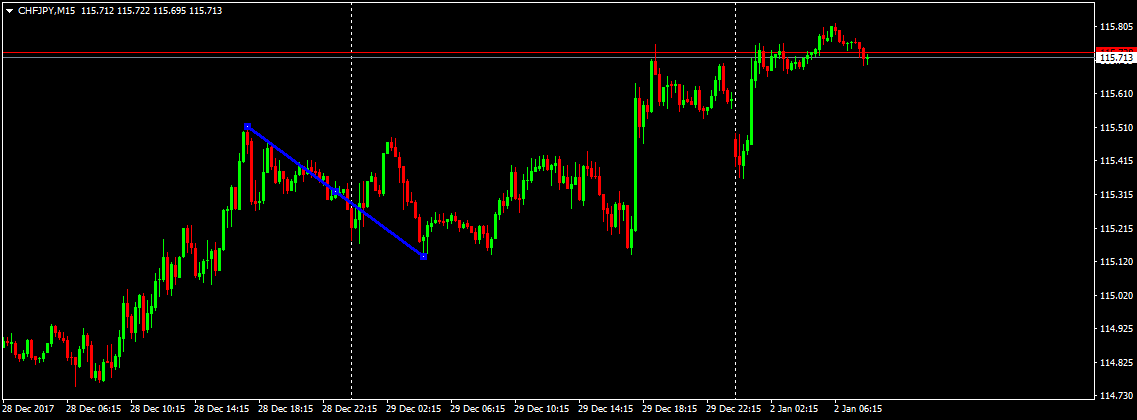 image url)
That Trend draw down identified by the blue line is what I want the EA to draw for me.
Here is what I have coded so far but it’s not working as intended.
https://fxdreema.com/shared/NwuBizIsc
My question is how to manipulate the blocks to show the biggest draw down or pull back in a trend.
Thanks for the help. -
You need to give more information, what it is exactly you are trying to do.
Is the blue line = close of candle id 200 to lowest/highest point of last 200?
Why are you comparing id 1 and id 200? Wouldn't using MA rising/falling a more confident way?

-
What am trying to do is simple.
I look at the last 200 bars on a chart on any time frame.
Within those 200 bars I look for the direction of the trend, which is sometimes obvious and on a choppy chart not so obvious.
In other to determine the trend I have decided to look at close price of bar 1 and bar 200. If bar 1 > bar 200; uptrend. If bar 1 < bar 200; downtrend.
So the blue line is supposed to be the biggest retracement within the last 200 bars which is the highest high to the next lowest low before the chart continues in the upward trend.
-
When it comes to looking at the past candles and make some calculations, and then print something on the chart, this is clearly a job for some custom indicator. Unfortunately I can't offer indicators builder. In theory it can be done in the EA as well, but it will be not optimized at least. The code in the custom indicators is structured a little bit differently, so new calculations are made only when needed. It's much harder to do something like this in an EA.
-
Fair enough, I understand. Thanks for the response.