how to draw horizontal line at latest open trade stop loss price?
-
example:
1st trade : buy 0.1 with stop loss set at 138.45
2nd trade : sell 0.2 with stop loss set at 139.003rd trade : buy 0.3 with stop loss set at 138.00 <== draw horizontal line at this stop loss price level
how to do so?
-
@someone-else You can store the value of that SL in a variable and then use this block:
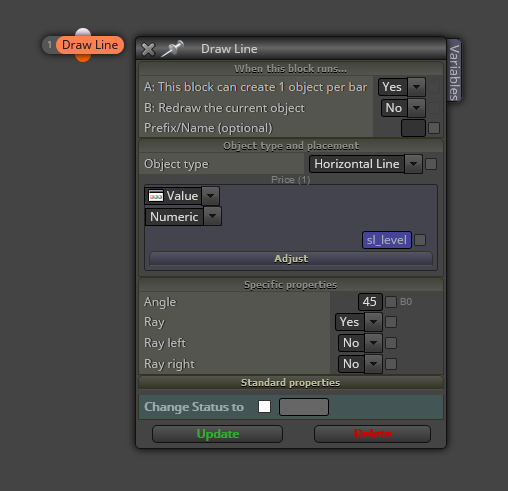
-
@l-andorrà sry but how to store the value of that SL in a variable? Can pls make an example for me. Tq very much.
-
@someone-else You can rty this for a buy SL:
-
@l-andorrà ok tqvm. It work.