Combining Indicators
-
Please help if you can. I'm very new to this. So please forgive my lack of knowledge. I am attempting to combine 2 indicators to provide signals. Indicator "A" has a fixed range (0-100) with levels I can easily set. Indicator "B" has a very dynamic high range, depending upon the instrument, (0-infinity).
My challenge is how can I utilize this platform to create a dashboard that provides signals when indicator "B" is above various levels of indicator "A", despite the fluctuating ranges of various instruments?
I would greatly appreciate any leads that might point me in theright direction. -
@mrrick11 did I understand: you put 2 indicators into same window and visually checked how they move over one another, even though they use wildly different scales? You cant compare indicators with different scales, you'd have to account for your monitor size, your pixel density, chart scaling etc - its really not the way to go.
-
Visually, all is well. However, my goal is to create a dashboard that will provide signals whenever various forex pair, indices, metals, etc., reach key levels.
I can watch any given instrument, and the alignment is great. I have tried, identifying the high range of a currency pair - for example. Then divide the high by 10, and creating an indicator to provide the desired signals, but that only provides correct signal for that pair, during that day, and for other pairs with a relatively similar high range.
Currently, I'd have to redo every calculation, and every prospective instrument I want to monitor, constantly. I was thinking, if I were to somehow combine the 2 indicators, that all the proper math, and alignment could be handled within the code. I have been searching around the net, and seeing a few topics touching upon the topic. One mentioned something call using a "geometric mean", that seemed a bit extreme for what I believe should have a much simpler solution.
Your thoughts? -
@mrrick11 please post some picture of what you mean, how would those 2 indicators "align"
-
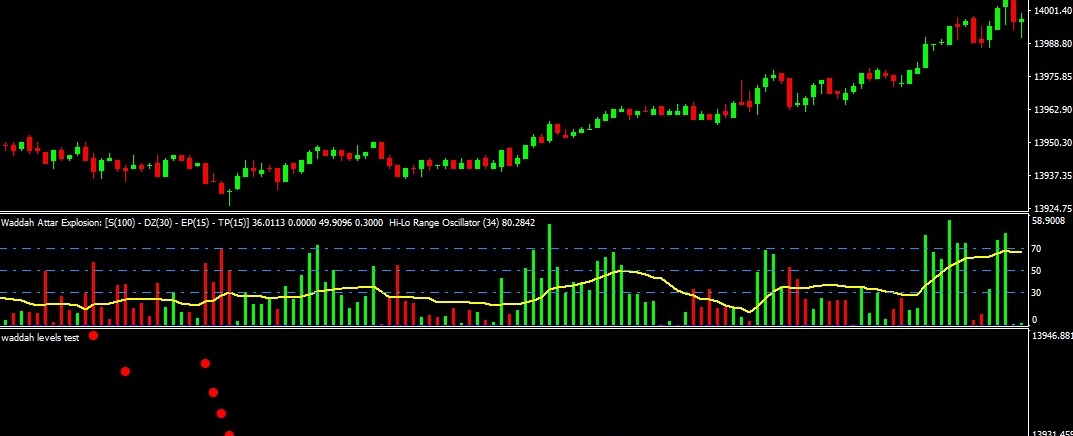
Attached is a photo of what I am attempting to achieve. The Waddah Attar Explosiosion (WAE) is the primary focus, and the Hi-Lo Range Oscillator - without the signal line, is the static range I would like to use across the board.
Again, the range of WAE changes so dramatically, depending on what is being traded, it has been difficult figuring out how to get consistancy across the board.
-
@roar I got it!!!! Yippie. Thanks for being open to helping me.
-
How did you combine 2 indicators