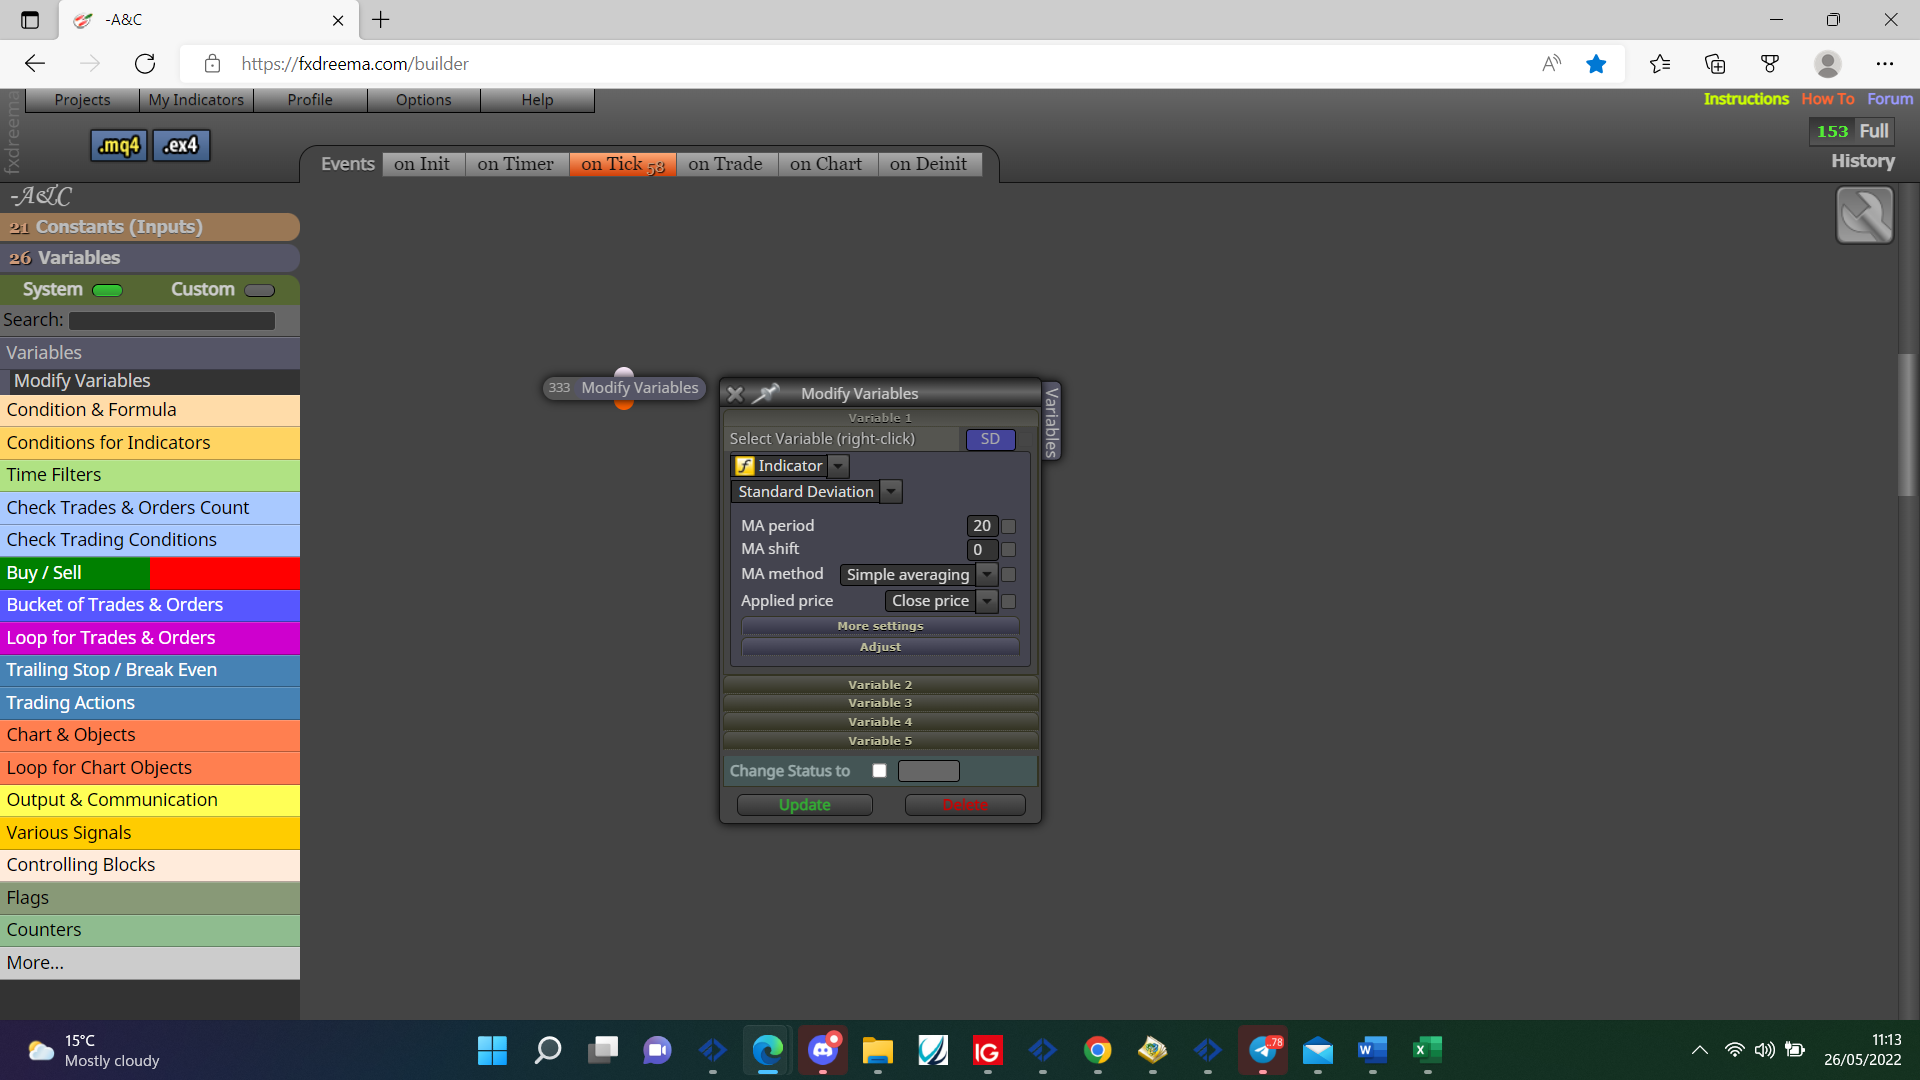
I want to get the average price between the 2 prices shown in the Standard Deviation indicator
-
Can you help?
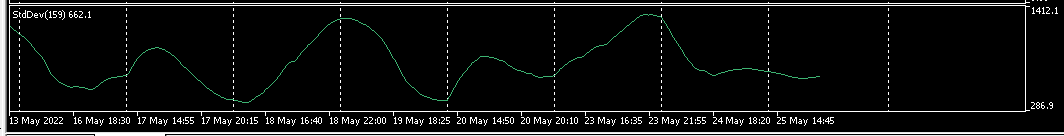
Notice that in the image I have:
The highest price 1412.10
The lowest price 286.9
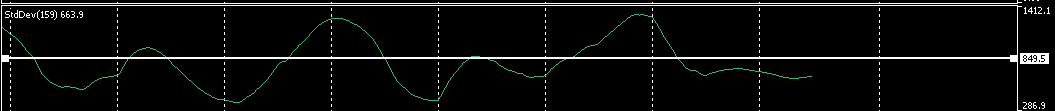
So I did the calculation 1412.10-286.90 which resulted in 1125.20
So I divided by 2 which resulted in 562.60
I added 562.60+286.90 which resulted in 849.50 and so I found the middle between the 2 prices.
But I'm not able to capture the highest price and the lowest price to do this, can you help me find them?
Sou do Brasil e utilizo o sistema Fxdreema a alguns anos, sempre que tenho tempo disponível eu tento ajudar alguém por aqui, mas se quiser uma ajuda mais próxima me contacte:
Site: https://www.ontradingx.com.br
Youtube: https://www.youtube.com/@ontradingx
Boa sorte a todos nós!English - I'm from Brazil and I've been using the Fxdreema system for a few years, whenever I have time available I try to help someone here, but if you want more help, contact me:
Website: https://www.ontradingx.com.br
Youtube: https://www.youtube.com/@ontradingx
Good luck to all of us! -
@ontradingx
Being more specific, I want to get the real-time values of the vertical scale of the indicator.Sou do Brasil e utilizo o sistema Fxdreema a alguns anos, sempre que tenho tempo disponível eu tento ajudar alguém por aqui, mas se quiser uma ajuda mais próxima me contacte:
Site: https://www.ontradingx.com.br
Youtube: https://www.youtube.com/@ontradingx
Boa sorte a todos nós!English - I'm from Brazil and I've been using the Fxdreema system for a few years, whenever I have time available I try to help someone here, but if you want more help, contact me:
Website: https://www.ontradingx.com.br
Youtube: https://www.youtube.com/@ontradingx
Good luck to all of us! -
@ontradingx Vertical is the same as candle ID, the indicator likely has a buffer containing the horizontal value.
Learn fxDreema Without the Wait!
My comprehensive book, available on Amazon, is packed with examples and invaluable insights to help you fast-track your learning journey.
The paperback and hardback editions include MT4 & MT5 QR codes for easy access to all prebuilt projects and robots, including my latest gold trading robot!
Don’t miss out
Click here➡️ https://mybook.to/fxDreema to get your copy today!
Enjoy! 😊
-
@jstap
But is there any way to get these 2 values?
Can you teach me how?Sou do Brasil e utilizo o sistema Fxdreema a alguns anos, sempre que tenho tempo disponível eu tento ajudar alguém por aqui, mas se quiser uma ajuda mais próxima me contacte:
Site: https://www.ontradingx.com.br
Youtube: https://www.youtube.com/@ontradingx
Boa sorte a todos nós!English - I'm from Brazil and I've been using the Fxdreema system for a few years, whenever I have time available I try to help someone here, but if you want more help, contact me:
Website: https://www.ontradingx.com.br
Youtube: https://www.youtube.com/@ontradingx
Good luck to all of us! -
@ontradingx Put the indicator here and I'll have a look.
Learn fxDreema Without the Wait!
My comprehensive book, available on Amazon, is packed with examples and invaluable insights to help you fast-track your learning journey.
The paperback and hardback editions include MT4 & MT5 QR codes for easy access to all prebuilt projects and robots, including my latest gold trading robot!
Don’t miss out
Click here➡️ https://mybook.to/fxDreema to get your copy today!
Enjoy! 😊
-
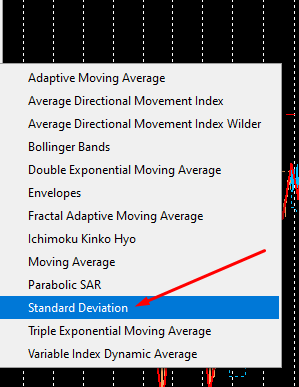
This indicator is standard metatrader 5
But we can get it also on the mql site
https://www.mql5.com/en/code/49Sou do Brasil e utilizo o sistema Fxdreema a alguns anos, sempre que tenho tempo disponível eu tento ajudar alguém por aqui, mas se quiser uma ajuda mais próxima me contacte:
Site: https://www.ontradingx.com.br
Youtube: https://www.youtube.com/@ontradingx
Boa sorte a todos nós!English - I'm from Brazil and I've been using the Fxdreema system for a few years, whenever I have time available I try to help someone here, but if you want more help, contact me:
Website: https://www.ontradingx.com.br
Youtube: https://www.youtube.com/@ontradingx
Good luck to all of us! -
@ontradingx So if it's standard deviation then putting it in a variable should give you the current value, by using candle ID you should get the value for a specific point in time, if you want a specific time for a value you will need to record the candle ID when price is reached, otherwise use time/ID to check value.