fxDreema

    • Register
    • Login
    • Search
    • Back to the main page
    • Categories
    • Recent
    • Tags
    • Popular
    • Search

    Draw Lines @ axis

    Questions & Answers
    3
    11
    776
    Loading More Posts
    • Oldest to Newest
    • Newest to Oldest
    • Most Votes
    Reply
    • Reply as topic
    Log in to reply
    This topic has been deleted. Only users with topic management privileges can see it.
    • TipsyWisdom
      TipsyWisdom last edited by TipsyWisdom

      I am attempting to draw lines on the chart based X and Y coordinates, in an attempt to put trend lines on my chart, to represent visual zones of time. I dont want to use price points because if the price point moves off screen, I want the lines to follow the time. Only way I can see that happening, is by constantly updating the point that they are printed on the X and Y axis, but I dont understand how to do it.

      roar 1 Reply Last reply Reply Quote 0
      • jstap
        jstap last edited by

        You can use this,
        ChartXYToTimePrice(
        long chart_id, // Chart ID
        int x, // The X coordinate on the chart
        int y, // The Y coordinate on the chart
        int& sub_window, // The number of the subwindow
        datetime& time, // Time on the chart
        double& price // Price on the chart
        );
        in custom code, save into a variable, redraw line using variable, X & Y will stay the same but lines should move with time/price.

        Learn fxDreema Without the Wait!

        My comprehensive book, available on Amazon, is packed with examples and invaluable insights to help you fast-track your learning journey.

        The paperback and hardback editions include MT4 & MT5 QR codes for easy access to all prebuilt projects and robots, including my latest gold trading robot!

        Don’t miss out

        Click here➡️ https://mybook.to/fxDreema to get your copy today!

        Enjoy! 😊

        TipsyWisdom 1 Reply Last reply Reply Quote 2
        • roar
          roar @TipsyWisdom last edited by

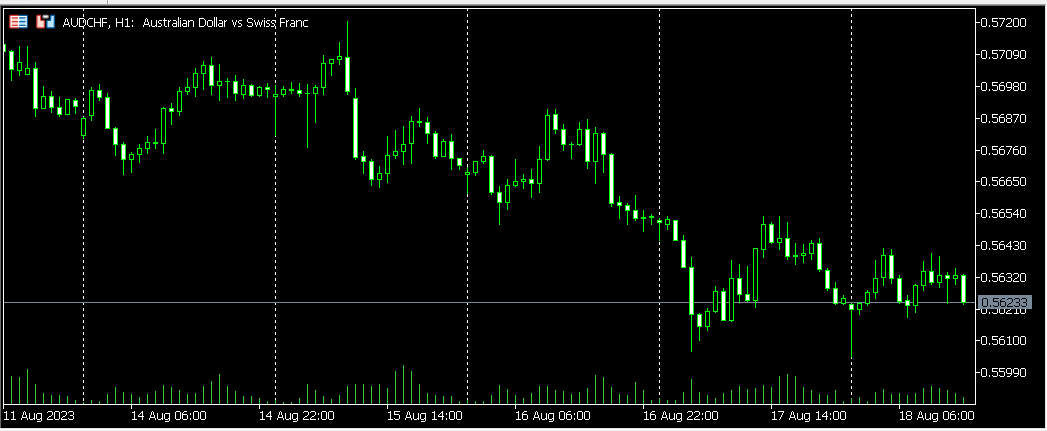
          @TipsyWisdom you mean something like the period separator lines?

          d43bded7-3be4-400c-9fae-fe6967a2ea73-image.png

          Need small help? Tag me in your post
          Need big help? https://www.fiverr.com/big_algo/automate-your-winning-strategy-in-mql4-or-mql5

          1 Reply Last reply Reply Quote 0
          • TipsyWisdom
            TipsyWisdom last edited by TipsyWisdom

            image.png

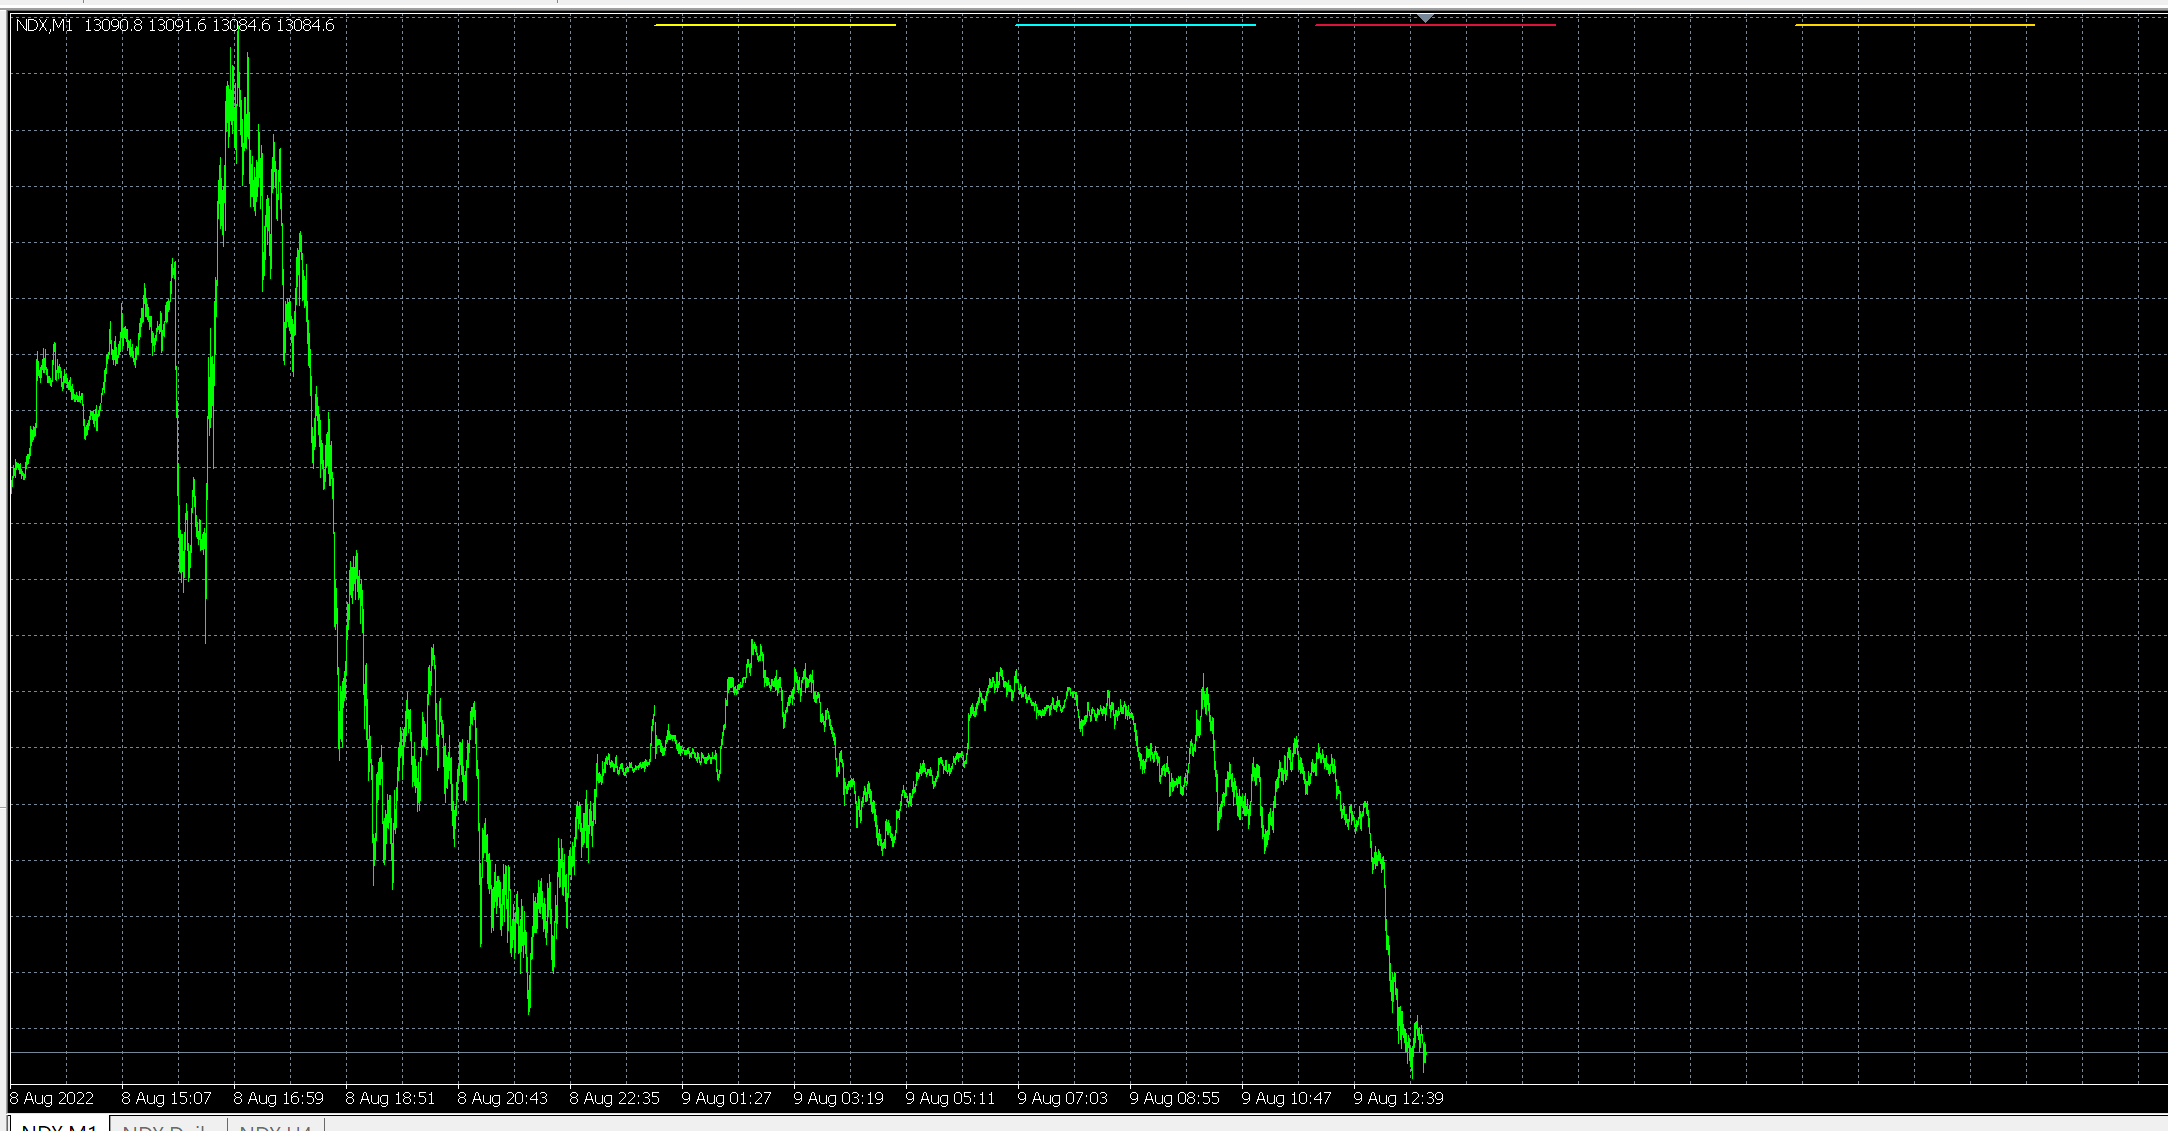
            like these. but these are price anchored. I want Y axis for where to put the lines, not price.

            1 Reply Last reply Reply Quote 0
            • TipsyWisdom
              TipsyWisdom last edited by

              the colored lines @ the top

              1 Reply Last reply Reply Quote 0
              • roar
                roar last edited by

                So you want a fixed Y point but moving X coordinate? Or both fixed - then you could use "rectangle label" object.

                Need small help? Tag me in your post
                Need big help? https://www.fiverr.com/big_algo/automate-your-winning-strategy-in-mql4-or-mql5

                TipsyWisdom 1 Reply Last reply Reply Quote 1
                • TipsyWisdom
                  TipsyWisdom @roar last edited by

                  @roar said in Draw Lines @ axis:

                  So you want a fixed Y point but moving X coordinate? Or both fixed - then you could use "rectangle label" object.

                  yea, for X coordinates, I would like to use my time stamp since I seek time first, but for the Y coordinate, I'd like to the bars of color to just to displayed visually at the top of the chart as high as I can get them.

                  1 Reply Last reply Reply Quote 0
                  • TipsyWisdom
                    TipsyWisdom @jstap last edited by

                    @jstap said in Draw Lines @ axis:

                    You can use this,
                    ChartXYToTimePrice(
                    long chart_id, // Chart ID
                    int x, // The X coordinate on the chart
                    int y, // The Y coordinate on the chart
                    int& sub_window, // The number of the subwindow
                    datetime& time, // Time on the chart
                    double& price // Price on the chart
                    );
                    in custom code, save into a variable, redraw line using variable, X & Y will stay the same but lines should move with time/price.

                    almost would work, but I want to time as one of the axis

                    1 Reply Last reply Reply Quote 0
                    • TipsyWisdom
                      TipsyWisdom last edited by TipsyWisdom

                      perhaps a more detailed purpose would help...

                      I am trying to mark zones of time that I am allowed to trade within, by placing a small colored line across the top of the chart to represent that frame of time I can trade within. There are several zones I need to show that should all be horizontally across the same plane.

                      Chart moves up, chart moves down, shouldnt matter. the lines should stay where they sit horizontally OnChart.

                      1 Reply Last reply Reply Quote 0
                      • jstap
                        jstap last edited by

                        Horizontal is price, vertical is time, explain more what you mean?

                        Learn fxDreema Without the Wait!

                        My comprehensive book, available on Amazon, is packed with examples and invaluable insights to help you fast-track your learning journey.

                        The paperback and hardback editions include MT4 & MT5 QR codes for easy access to all prebuilt projects and robots, including my latest gold trading robot!

                        Don’t miss out

                        Click here➡️ https://mybook.to/fxDreema to get your copy today!

                        Enjoy! 😊

                        1 Reply Last reply Reply Quote 0
                        • roar
                          roar last edited by

                          I think what's needed is x value as a datetime, y value as a pixel coordinate. A mix between label-type object and normal object.

                          So one option is to use rectangle label (fixed pixel coordinates) and continually update the x value with ChartTimePriceToXY function (ignore the Price->Y conversion in that function).

                          Need small help? Tag me in your post
                          Need big help? https://www.fiverr.com/big_algo/automate-your-winning-strategy-in-mql4-or-mql5

                          1 Reply Last reply Reply Quote 1
                          • 1 / 1
                          • First post
                            Last post

                          Online Users

                          E
                          D

                          12
                          Online

                          146.7k
                          Users

                          22.4k
                          Topics

                          122.6k
                          Posts

                          Powered by NodeBB Forums | Contributors