fxDreema

    • Register
    • Login
    • Search
    • Back to the main page
    • Categories
    • Recent
    • Tags
    • Popular
    • Search

    Variables and Formulas for retracement levels

    Questions & Answers
    0
    4
    234
    Loading More Posts
    • Oldest to Newest
    • Newest to Oldest
    • Most Votes
    Reply
    • Reply as topic
    Log in to reply
    This topic has been deleted. Only users with topic management privileges can see it.
    • Right Edge
      Right Edge last edited by Right Edge

      Hi,

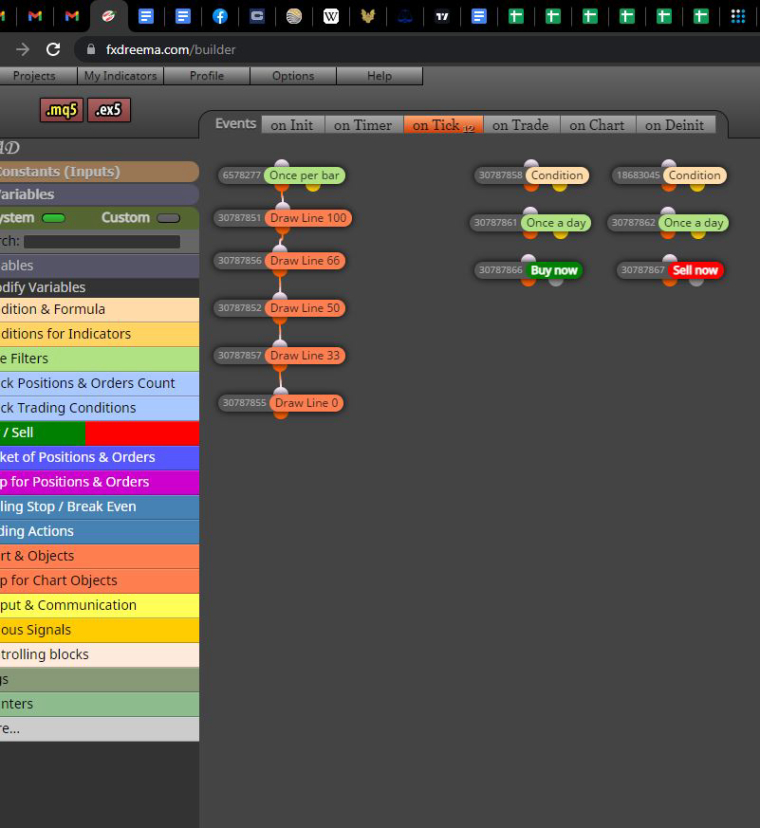
      I am trying to make my EA draw horizontal lines at the following percentage levels of the previous day:
      (100, 66, 50, 30, 0 )

      I accomplished the following:
      100 = Daily Bar 1 High
      50 = Daily Bar 1 Median price
      0 = Daily Bar 1 Low

      I tried Variable and formula combinations but I have had no luck with the 66 and 33 percent levels.

      Below is what I accomplished so far.

      0_1674067285121_6s54f6s54f65s4fsfsf.JPG

      0_1674067321199_dgjdgjhgdjhdj.JPG

      This is the project...https://fxdreema.com/shared/rsEtYrKub

      Thank you in advance!

      jstap 1 Reply Last reply Reply Quote 0
      • jstap
        jstap @Right Edge last edited by

        @right-edge If this will help but, if you add high to low divide by 2, you get the 50 mark, so divide by 3 and you get the 33.33 mark, divide by 1.5 and you get 66.66 mark, add and divide and you should get all the levels you need.

        Learn fxDreema Without the Wait!

        My comprehensive book, available on Amazon, is packed with examples and invaluable insights to help you fast-track your learning journey.

        The paperback and hardback editions include MT4 & MT5 QR codes for easy access to all prebuilt projects and robots, including my latest gold trading robot!

        Don’t miss out

        Click here➡️ https://mybook.to/fxDreema to get your copy today!

        Enjoy! 😊

        Right Edge 1 Reply Last reply Reply Quote 0
        • Right Edge
          Right Edge @jstap last edited by

          @jstap Thank you so much for your reply. Unfortunately, I am still having issues. I created the 66 and 33 with the mathematical formula you suggested and I still cannot get the EA to plot the trend lines along side the 0,50, and 100. I don't know what I am doing wrong my friend! If you have any other suggestions please share and thank you again.

          jstap 1 Reply Last reply Reply Quote 0
          • jstap
            jstap @Right Edge last edited by

            @right-edge Put this formula into a comment, this way you can see the number line would draw. If you use a calculator all numbers will match.

            Learn fxDreema Without the Wait!

            My comprehensive book, available on Amazon, is packed with examples and invaluable insights to help you fast-track your learning journey.

            The paperback and hardback editions include MT4 & MT5 QR codes for easy access to all prebuilt projects and robots, including my latest gold trading robot!

            Don’t miss out

            Click here➡️ https://mybook.to/fxDreema to get your copy today!

            Enjoy! 😊

            1 Reply Last reply Reply Quote 0
            • 1 / 1
            • First post
              Last post

            Online Users

            H
            S
            D
            M
            C
            M

            8
            Online

            146.8k
            Users

            22.4k
            Topics

            122.6k
            Posts

            Powered by NodeBB Forums | Contributors