Chart's grid highs and lows
-
Hi everyone,
Is it possible to use the grid of the chart to determine the highs and lows?
Thank you for your answers and clarifications. -
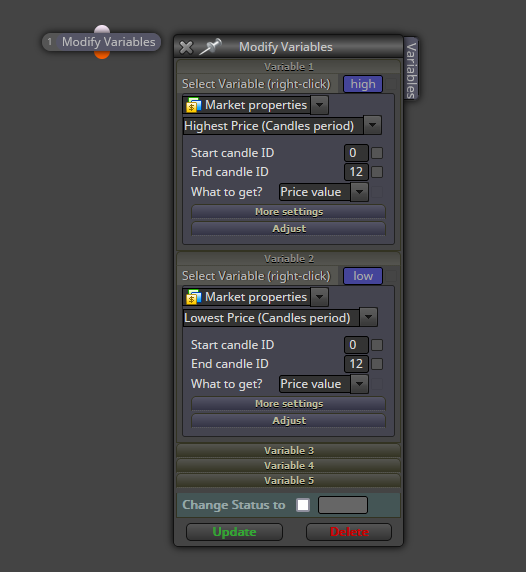
@Gilles What do you mean exactly? You can find the highs and lows of a candles period by doing this:
-
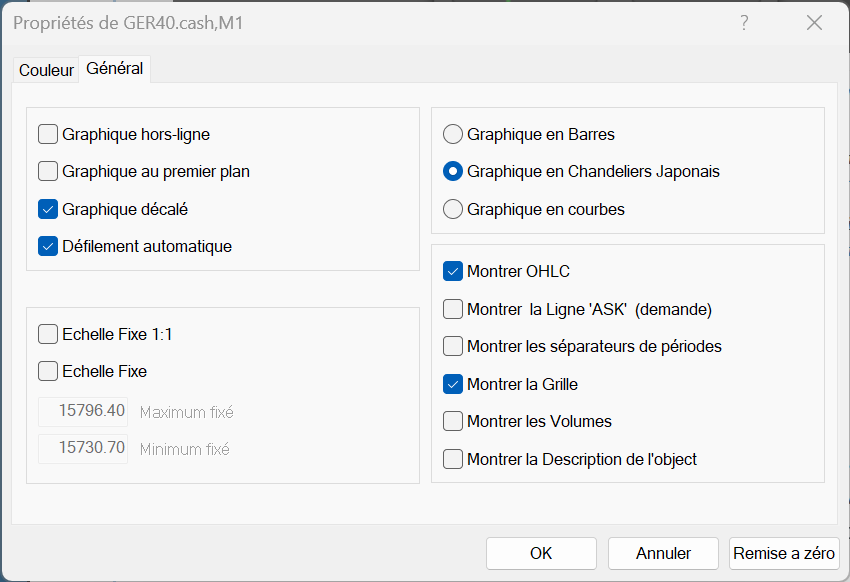
@l-andorrà As you have probably understood, I would like to use the MT4 chart grid, in other words, its MT4 viewport. When choosing to display the MT4 grid on the chart, price intervals are indicated and change over time. These visual markers are important to me. If the time unit chosen is M1, the chart displays a certain number of candles based on the determined zoom and the size of the screen used. Well, in this display area, I would like to know if FXDreema allows for retrieving and utilizing the information displayed within this interval. I hope my explanation is clear enough. Thank you for your responses!
")
-
@l-andorrà In this image, we can clearly see that the fixed scale, which adjusts to price variations over time, allows for obtaining a fixed maximum and a fixed minimum. I would like to know if FXDreema allows for retrieving this information in order to utilize it. Thank you!
-
Then I'm afraid that is not possible in fxDreema as an automatic function. What you can do is designing a template on your MT4 terminal with horizontal lines and then fxDreema can identify those lines if they are named properly, is, a different name/number for each line.
-
That's unfortunate. Thank you for the clarification.
-
You're welcome.