Why my backtest graph shows D1 candles if I tested the EA with H1?
-
Hello
I need help to understand what is wrong with my backtest graphs in Metatrader 5.
I am testing an Expert Advisor built using FxDreema with a H1 timeframe. After the EA optimization I take some optimized results and I test them for checking the trades. What I am not understanding is why MT5 shows me a D1 graph if I used a H1 timeframe for the optimization and backtesting.
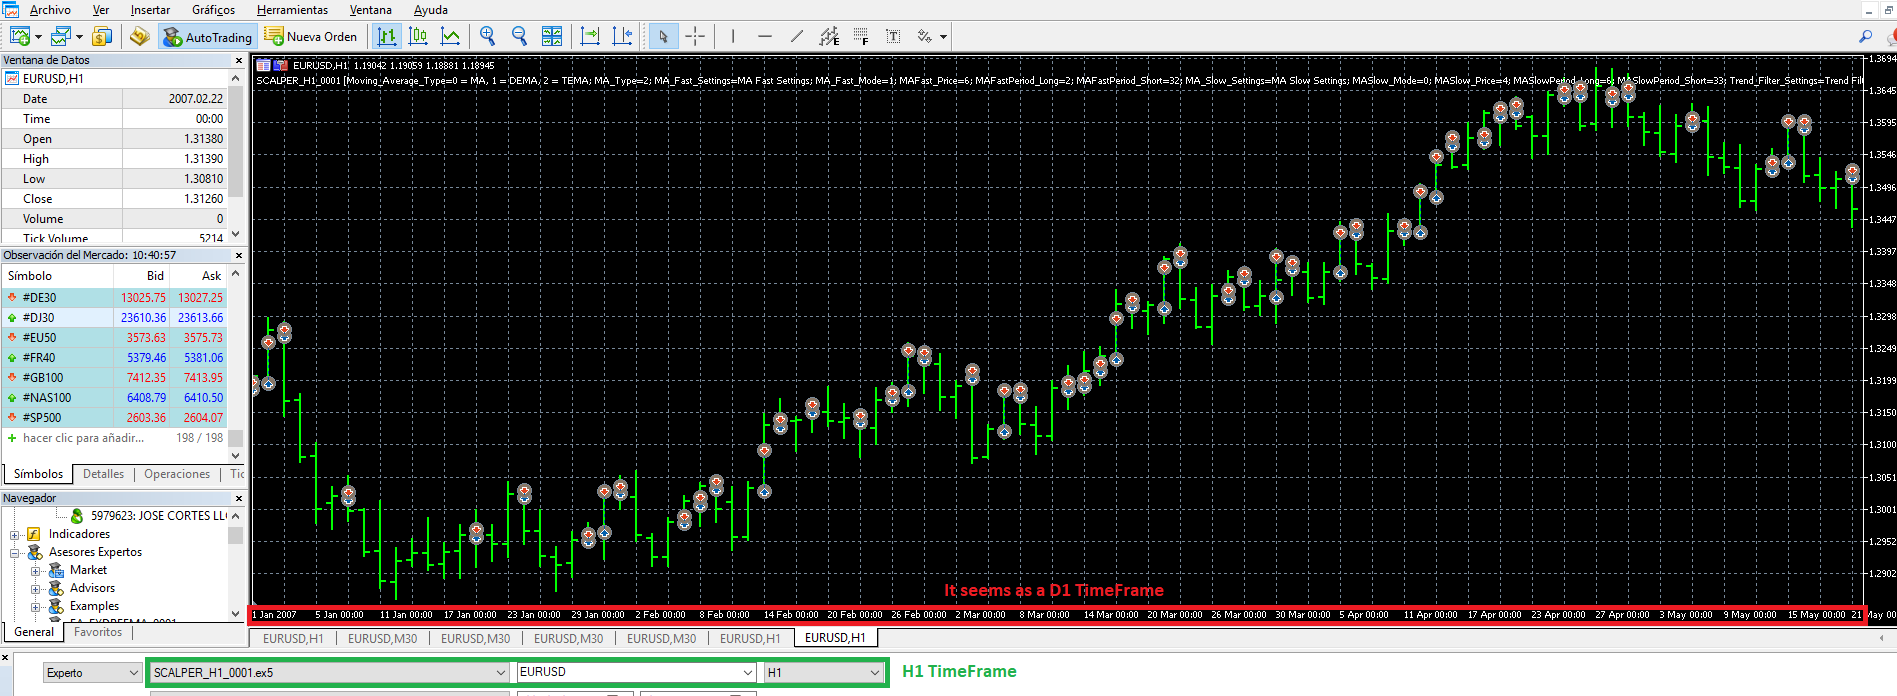
Any idea what I is wrong with that? Maybe is a bad setup.
Thanks a lot
-
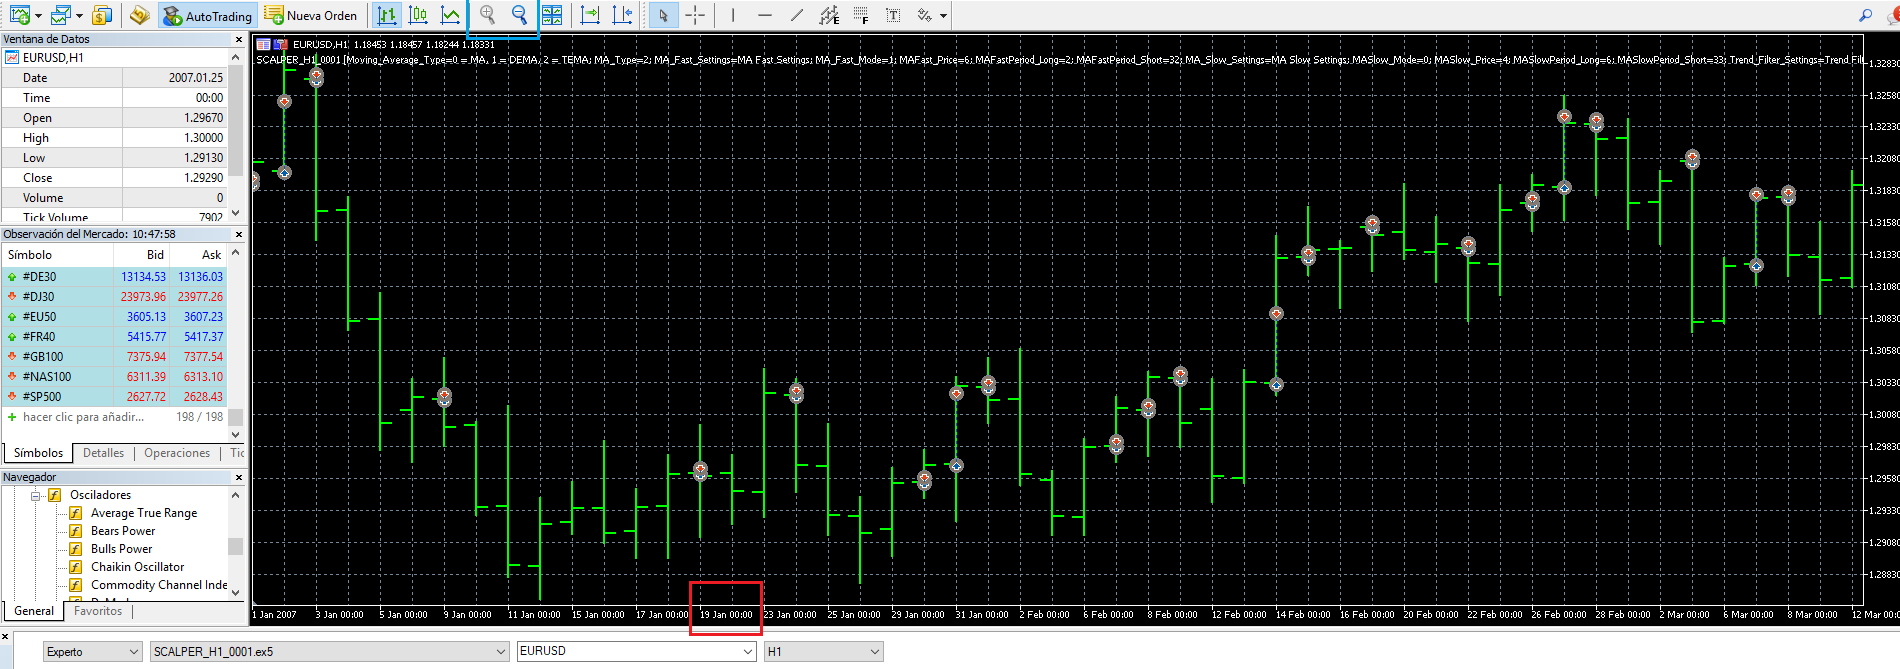
Those dates on the bottom of the chart are printed automatically, depending on the zoom. Zoom in and you sill see hours like 04:00, 10:00 and so on... The chart is H1 (which means 1 Hour) and you can see that easily, it is written everywhere
-
Hi fxDreema
Thanks for your response.
I will zoom in but it is happening the same. When I expect hours like you said, the time is showed per days (i.e. 19 Jan 00:00).
I wrote to the MT5 support to ask about that, they said this:
"Thank you for contacting us.
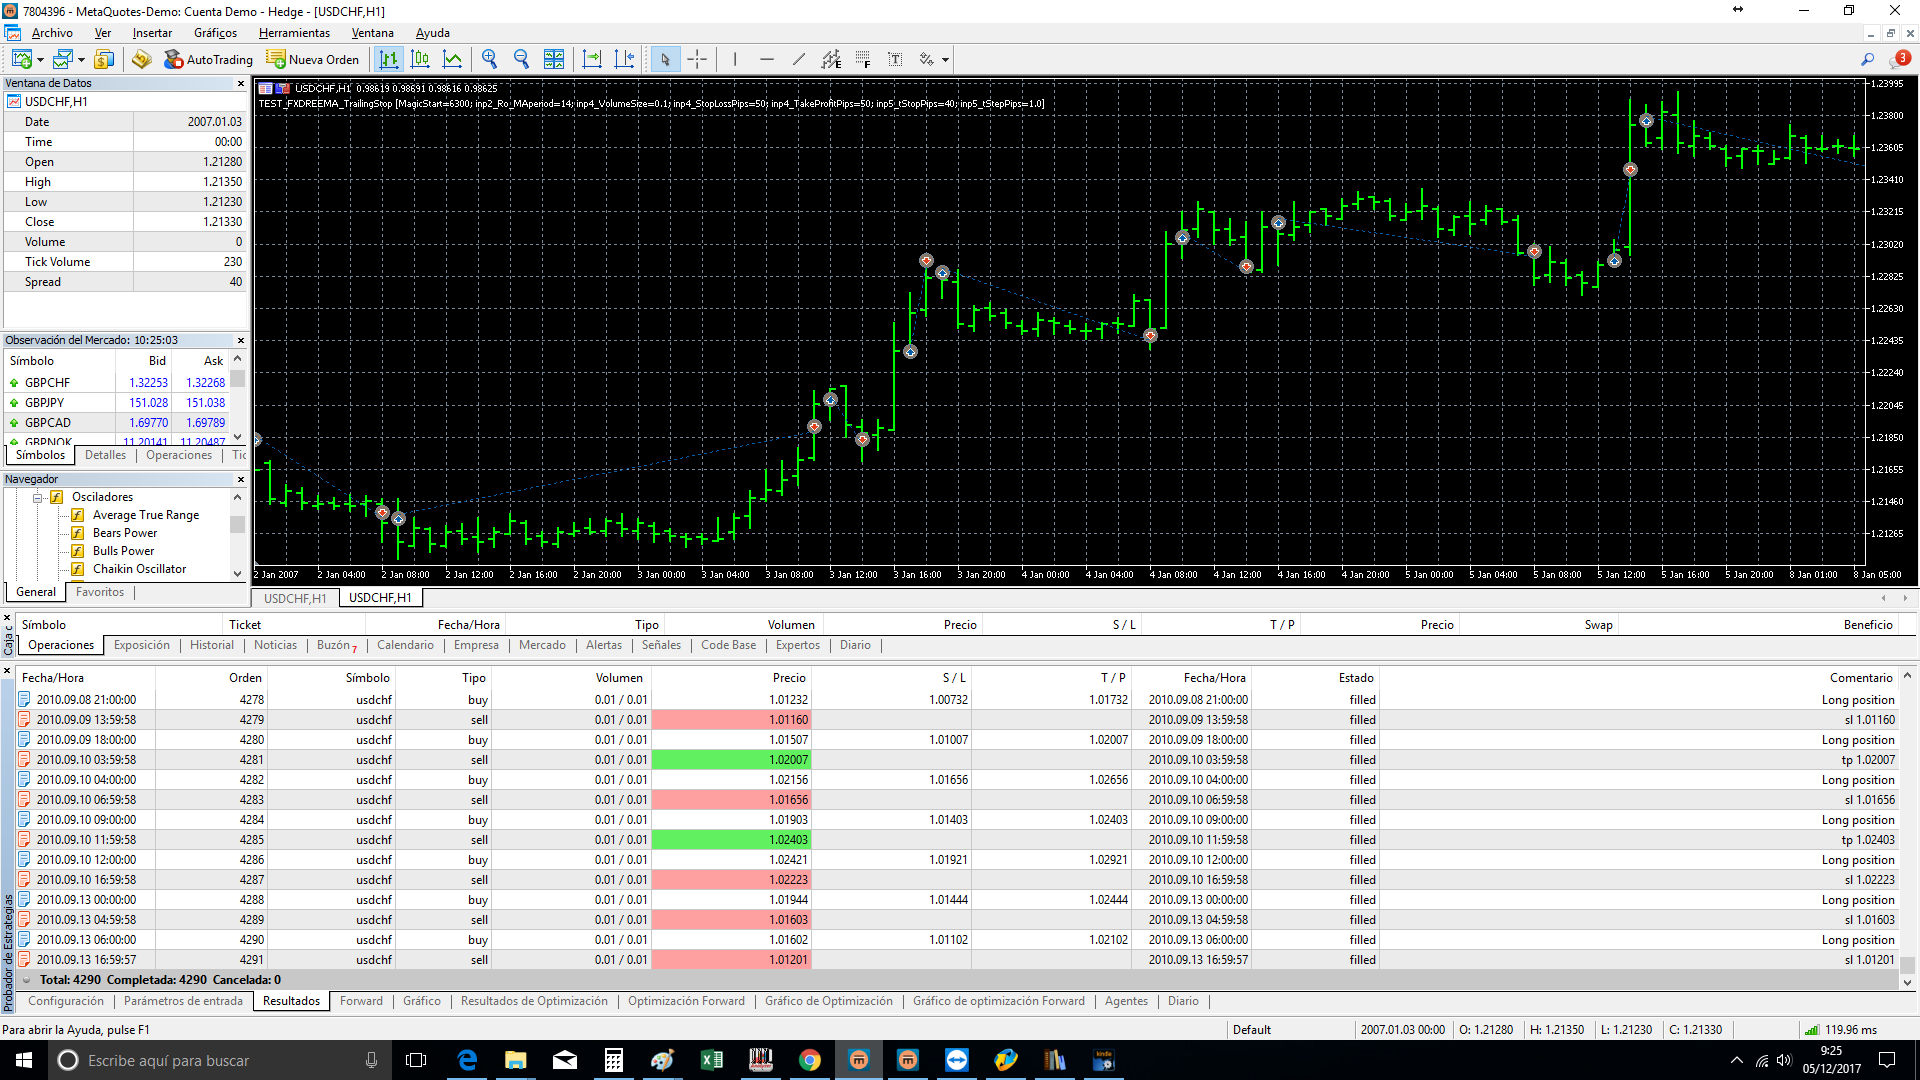
Try to test in "Every tick" mode and for the last year (from the 1st of January 2017) and pay your attention to the line in the Tester's journal, like:
EURUSD: history data begins from .........
Best regards, MQL5.com Support team"
I have test it as they said and the result is the same: each bar belongs to a day.
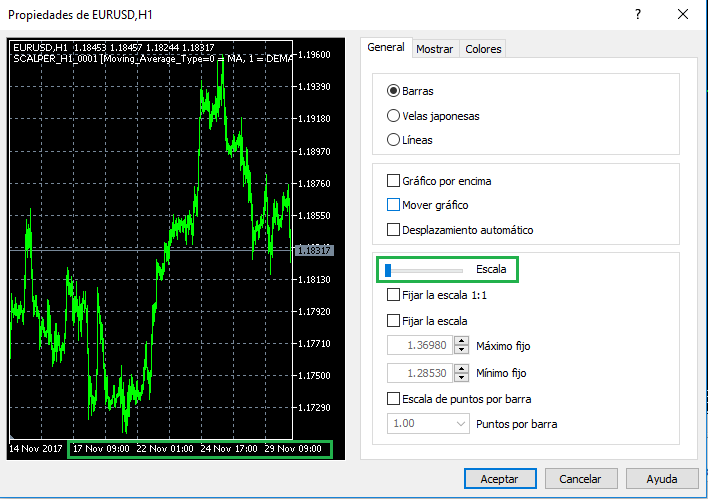
I have found one option from Graph Properties that change the value on the date axis but even though I save the right parameter, the graph is still showing the wrong TimeFrame for each bar.
I don't think this is related to fxDreema EA because it happens the same with the examples on the MT5 (i.e. Moving Average.ex5)
Thanks
-
I think this is some MetaTrader bug. Try with the classic action - reinstall
")
-
Hello fxDreema
Your help is very useful.
I don't know what it happens but after an update released some days ago, now it is working as expected.
The MT5 update was the build 1687.
I appreciate a lot your help.
Kind Regards