Your browser does not seem to support JavaScript. As a result, your viewing experience will be diminished, and you have been placed in read-only mode.
Please download a browser that supports JavaScript, or enable it if it's disabled (i.e. NoScript).
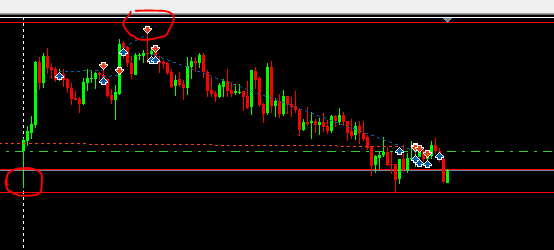
Hello friends I would like to know how I can identify the tops and bottoms on the chart based on the candles, I want to print an alert or warning through the image on these tops and bottoms found on the chart.
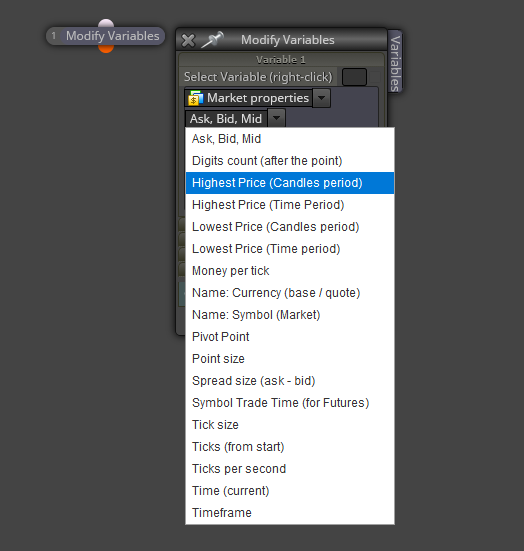
You can find those highs and lows here: