Plot horizontal line in specific value.
-
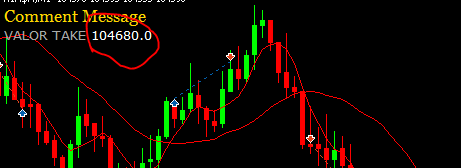
I want to plot a horizontal line in the value that is displayed according to the image.
the line is not showing, can you help me understand why?
follows shared project. https://fxdreema.com/shared/pBSOmr7ne
-
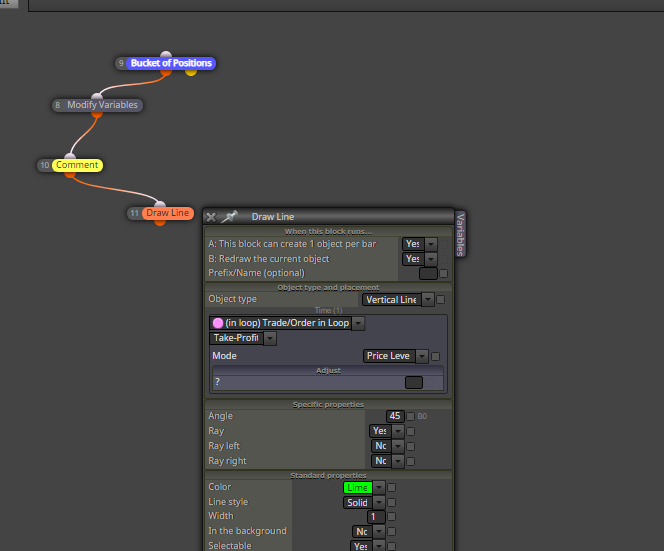
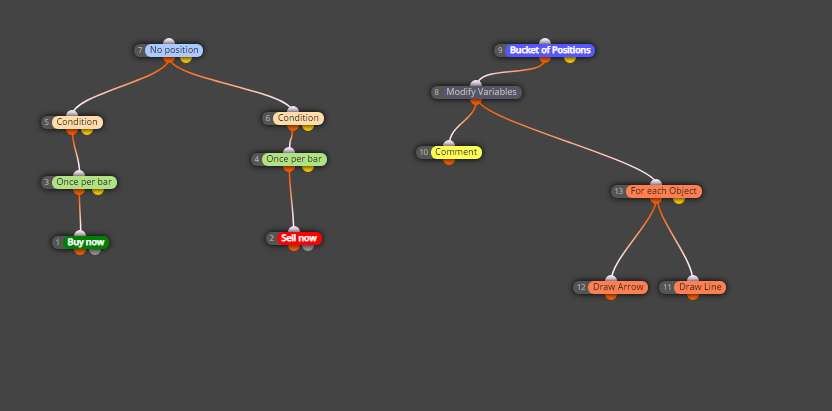
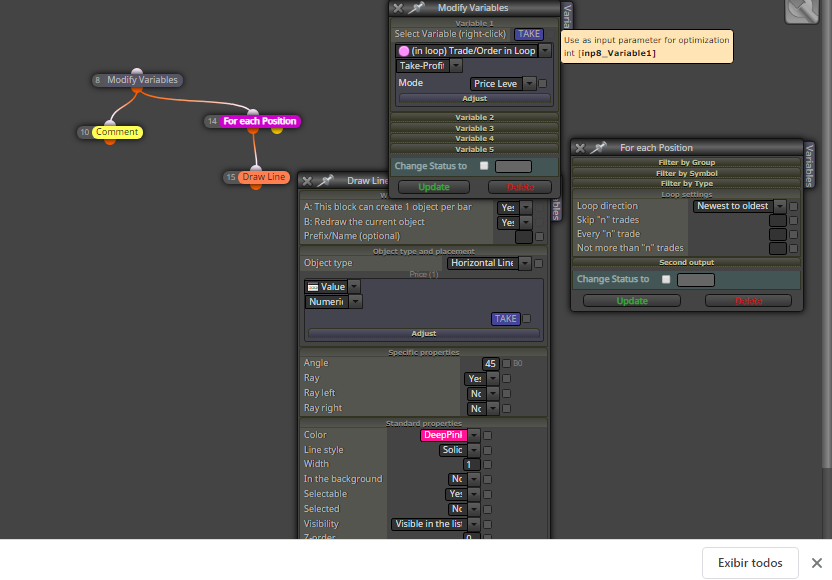
You must select a trade before reading its properties. So put the "for each trade" block before drawing the line.
-
https://fxdreema.com/shared/2DA0gEKVcontinues in the same way without projecting the line, I put it according to the image.
-
@roar to be more specific:
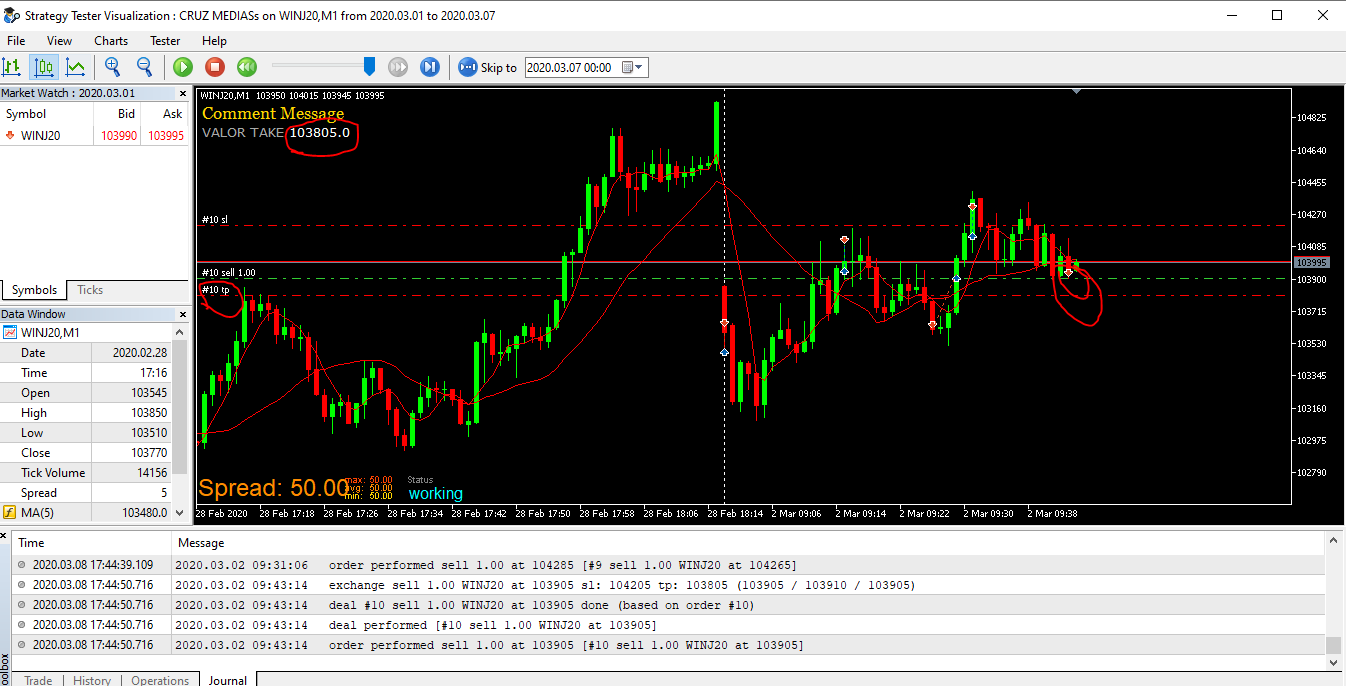
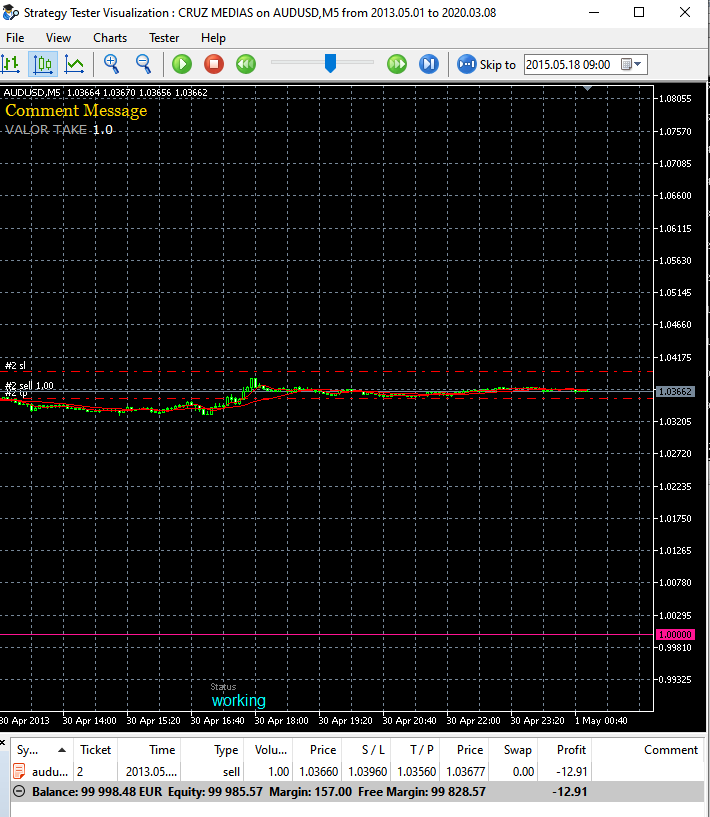
I want a line to be printed on the graph at exactly the value that appears in the comment "VALUE TAKE" which, for example, in the image is at 103805.0
Note that in the image I also marked where the Take profit line is, along with this line, a new line must appear and remain on the screen.This number 103.805.0 is the price that was defined as Take profit in trading, I managed to plot this number in a variable, so any number that appears in the "VALUE TAKE" must insert a horizontal line so that I know where the take targets were profit on each trade that was opened.
-
https://fxdreema.com/shared/TPd0TnRAd project shared
-
@fabiobioware Oh, here's the problem:
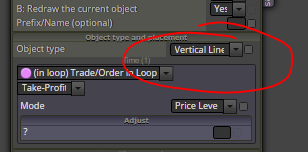
Vertical line goes from up to down,
horizontal from left to right -
vertical or horizontal it is not printing the line I want on the graph.
-
@fabiobioware I changed from vertical to horizontal and got a line. The variable doesn't update, though, because your "modify variables" doesnt select the trade.
-
@roar working fine now, thanks for the support.