@l-andorrà two simple ways (if I understood your request correctly), one by check the box, one by constant type color
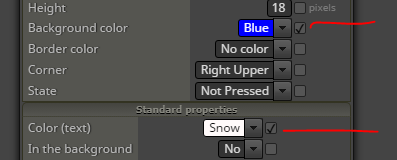
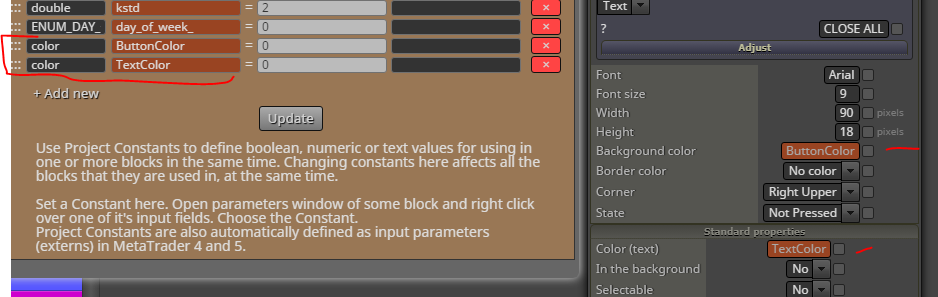
@l-andorrà two simple ways (if I understood your request correctly), one by check the box, one by constant type color
@narsha here you go, 99% quality https://tickstory.com/product/tick-data-suite/
for free version you can download only one year at time
@mostafa66M what other users just said is right, but since you are interested in using this indicator you can take the "indicator appears" block using buffers #1 and #3 inside it.
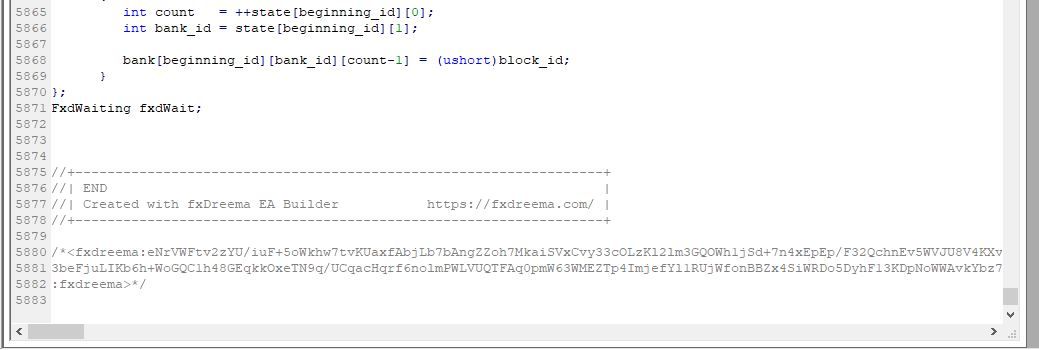
@trading4life said in Problem to see the code in fxdreema:
yes it was created here in fx dreema. i can open the code in mql5 and shows that was created here. I have other version that could be display on fx dreema but this one not
surely the creator handled the encrypted lines at the bottom of the code that allow you to import the file into dreema builder.
remove -1 in adjust field of #95 modify variable
my friend, now i don't have much time these days, sooner or later i will look. I suggest you open a new topic. Basically you need a loop to apply the formula to all the candles (7-5) (6-4) (5-3) (4-2) (3-1) until new high is trigger, when a new candle forms they begin (8-6) (7-5) (6-4) and so on........
@tec-nacks said in I need help on this:
@ambrogio what I want to do is; trace from ID 7 to the most recent lowest low, for the most extreme imbalance or Order Block that is closest to the ID 7 candle.
if we were now on the chart, the condition should be like this: high candle ID4 - low candle ID6 == the size of your imbalance. Need to update the candles ID for each candle passes, like the project above
@tec-nacks said in I need help on this:
@ambrogio Waow....OMG
This is incredible..didnt see it coming
Thanks..
What about the FVG>?
I don't know, what would you like to do?
@tec-nacks sorry but, i just realized now that you don't need each candle to be higher than the previous one, so simply two blocks in a row like these are enough to find the highest ID7
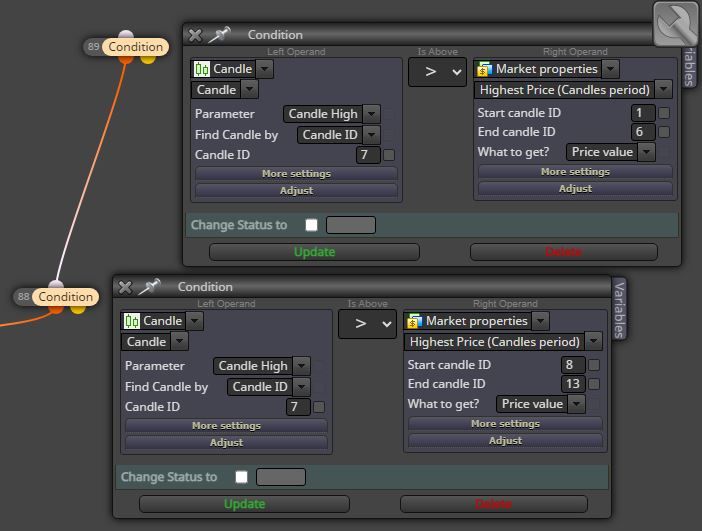
@tec-nacks and I got a little touch I wanna add to it, which tracing from ID 7 to the most recent lowest low, for the most extreme imbalance or Order Block that is closet to the ID 7 candle.
Please, draw few line by hand on a chart
@tec-nacks Can you jsut explain how you thought of that way..of course i could read the handwriting but come on man...that's magic
In the meantime i make this more logical little change (moving modify variable below draw support)
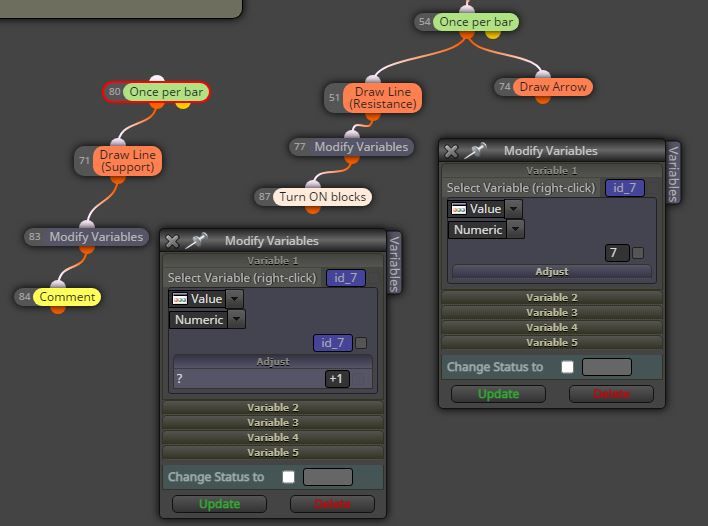
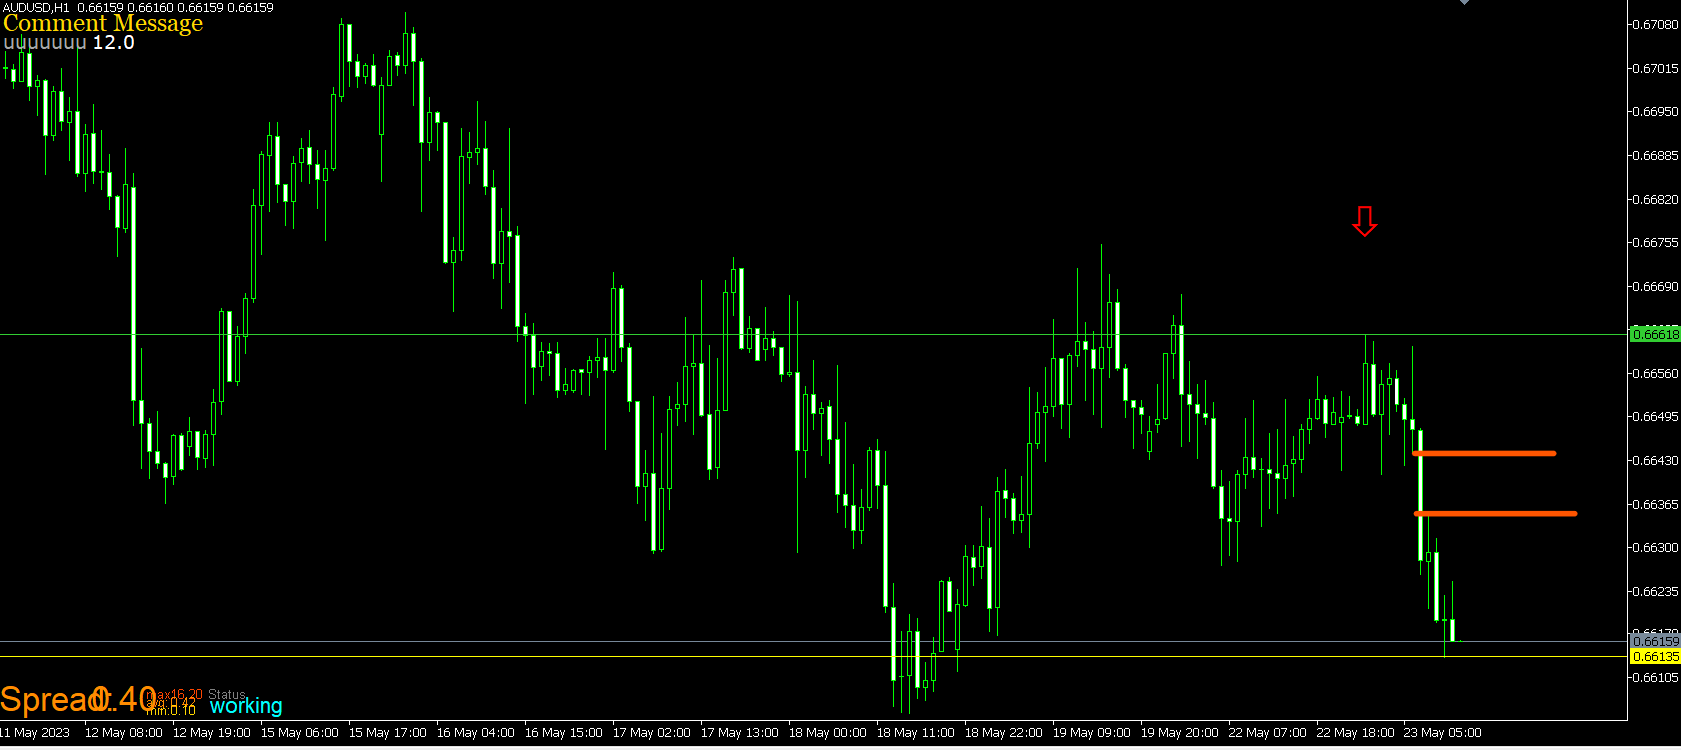
This is: when your 13/14 candles setup is trigger, we save candle id7 and turn on "once per bar", at this point on every candle we increase id7 + 1 , that's for have the same candle (red arrow) reference for the range of candle inside the draw support block.
seems a little bit complicate but no so much
https://fxdreema.com/shared/LnLSEkvN
so......once the green (high) line is drawn, do you want the red line at the first low from now to the high you just found?
still missing the variable. In this link we draw a "line" at 0.6678 on AUDUSD
Check it
https://fxdreema.com/shared/OkicvGymd
backtest from 15/05/2023
@tec-nacks said in I need help on this:
@ambrogio yes, this logic is correct for the resistance high. The Arrow draw at the exact place the line does correct for the High.
What's left is the most recent low with minimum 7 candles away from the resistance. High
just reverse the condition......low instead of high....or not?
you are missing the variable "coun" and you are making a boolean condition instead value numeric count == 3 numeric
You are searching a line named "line" , are you drawn it manually yes?