I found the answer just after writing my post : it's the MQL code that does not manage it correctly. ")
C
Latest posts made by cosmo
-
RE: For each objectposted in Bug Reports
-
RE: For each objectposted in Bug Reports
I tried many ways to make it count correctly, but it looks totally broken. It can't count correctly. Same here.
-
RE: Working with SMT divergence : how to compare values to trace trendline (the SMT) ?posted in Questions & Answers
I just don't know how to compare the values with a custom code. I can write what I expect from that bloc and the structure of the actual code around, but I don't know how to write the code...

-
RE: Working with SMT divergence : how to compare values to trace trendline (the SMT) ?posted in Questions & Answers
That a good advice.
For this case, I did it this way : step by step, testing, going back to the editor, etc... but I ended up just having absolutly no idea how to compare the values, even if I knew exactly what needed to be compared and done to make it work.
I'll find something else.
-
RE: Working with SMT divergence : how to compare values to trace trendline (the SMT) ?posted in Questions & Answers
I tried a lot of things for the last two days, nothing works. I'll find anything else to do with my EA.
-
RE: Working with SMT divergence : how to compare values to trace trendline (the SMT) ?posted in Questions & Answers
And I use a simplified logic each time to test each sub-logic on a corner of the main project

-
RE: Working with SMT divergence : how to compare values to trace trendline (the SMT) ?posted in Questions & Answers
What do you mean exactly ? I know the general process I want to go to, as I explaiend it above, but I don't know how to it, either with a code or with native blocs of fxdreema.
Here's what I have :
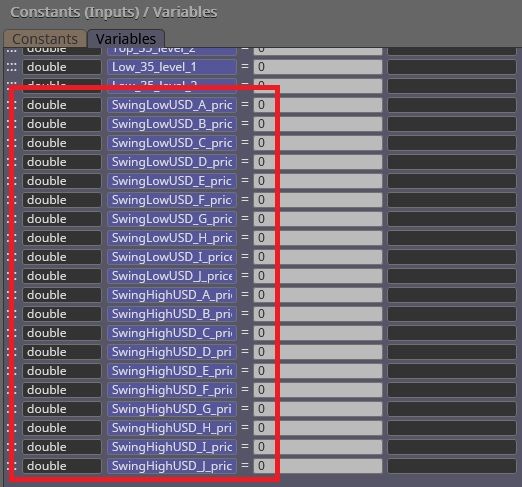
The price values for USDINDEX are all stored here, for the highs and the lows.
And then they are embeded in the description of their equivalent arrow drawn on XAUUSD :
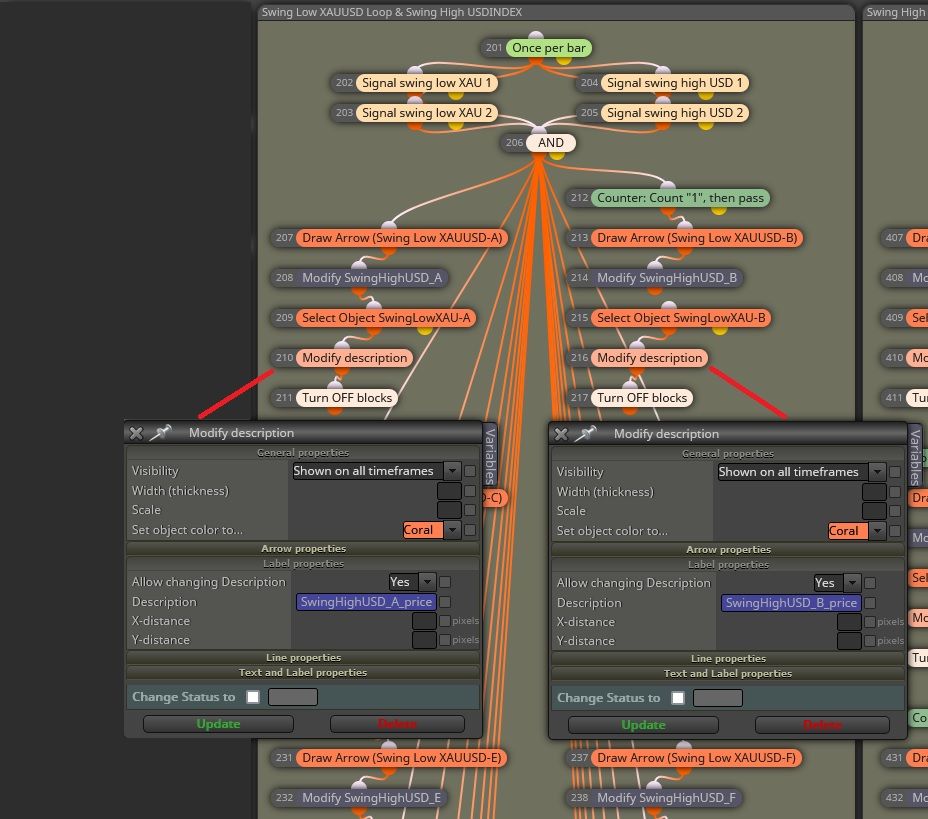
The time value of the swings for USDINDEX is the same as its equivalent drawn on XAUUSD, and both time and price values of the swings for XAUUSD are directly accessible because arrows are drawn on the chart.
So I think I have everything, no ?
") Now, how do I get it to work, in details ?
Now, how do I get it to work, in details ?I need :
- to compare the values as paired in the matrix above and if the condition is met, draw a trendline between the points on XAUUSD ;
- to avoid validating a divergence if the market pass through between the points on either USDINDEX or XAUUSD ;
- make the comparison for the four cases of SMT Divergences I detailed in my first message ;
- create a variable / flag / system that indicates to the EA that we have "that" type of divergence, that allows a long / short entry.
But let's go step by step : first, how to compare the values and avoid creating 5000 blocks ?

Thanks again for your help... This one is tricky
-
RE: Working with SMT divergence : how to compare values to trace trendline (the SMT) ?posted in Questions & Answers
Hi jstap, and thank you for your answer.
Well, I will simplify it for you : I need a code that compare the values of swing A with all of the others ;
B with all of the others (including A, of course) ;
Same for C, D, E, etc... to JAnd this, for both the values of XAUUSD (stored directly in the drawn arrow) and USDINDEX (value stored in the equivalent swing on XAUUSD in the arrow's description as string, time value is the same as the equivalent arrow)
Example : for the lows on XAUUSD paired with the highs on USDINDEX, Bullish SMT :
If the first value is lower than the second on both assets (XAUUSD and USDINDEX), then we have a Bullish SMT Divergence only if the market never created a new structure below these two points.For the four different cases, see my first message, SMT Divergence section.
If this condition is true, then I'll need a flag or a variable to store the info that a Bullish SMT Divergence has just been created, and that it's fine to enter in a long position.
That's it.
How to compare these values ? -
RE: Working with SMT divergence : how to compare values to trace trendline (the SMT) ?posted in Questions & Answers
Hello @l-andorrà and thank you so much for your answer ! I did as much as I could yesterday :
Merging the four initial loops into two
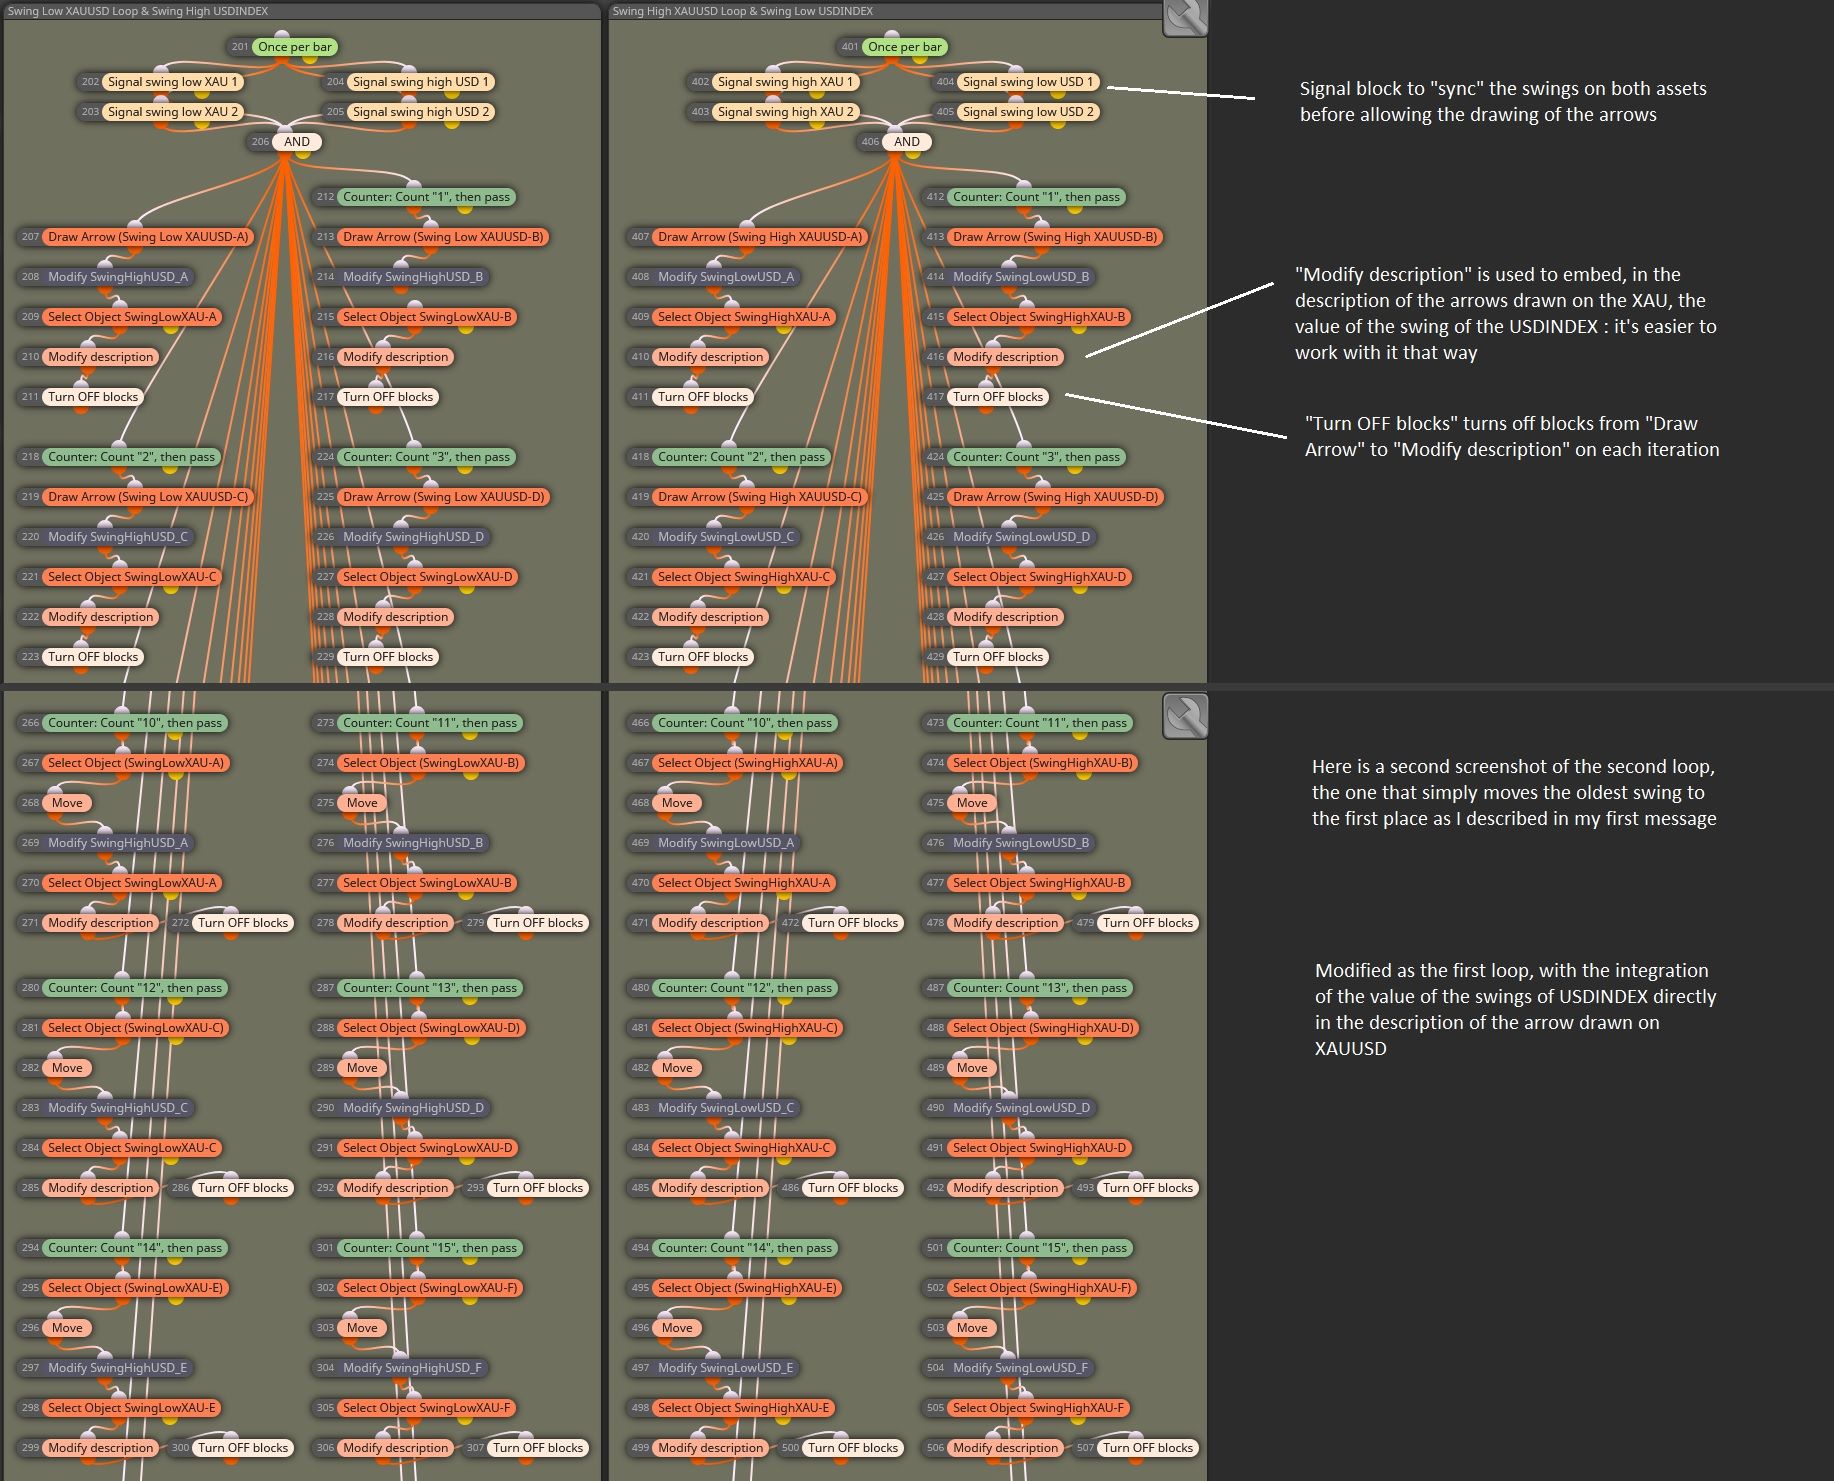
Here's what I did : I simplified the logic so that I only have two big loops now : one for the swing high and one for the swing low, each one drawing arrows and collecting / storing the values of the swings of USDINDEX directly in the description of the arrows drawn on XAUUSD (picture is cut, it only shows a part of each loop).
So now, with these two areas, I have a full tested and working setup that :
- draw an arrow on each synchronized swing high or low appearing on XAUUSD and USDINDEX, from A to J and start again ;
- collects and store the values of each swing high or low of both markets in the arrows.
Going further
Now, I'm going further : next step, is the one I'm still struggling with : easily compare the values. I used a simple code found on the forum to transform the string value in the description of each arrow into a double, and compare its value with the one of the newt swing :Example for the comparison of the values of the swing high A and B of USDINDEX, each one embeded in the description of the arrow (swing low) A and B on XAUUSD :
StringToDouble(ObjectGetString(0, "SwingLowXAU-A", OBJPROP_TEXT)) < StringToDouble(ObjectGetString(0, "SwingLowXAU-B", OBJPROP_TEXT))And it seems to work properly. But I still need a way to compare all the swings in a simplest way, because if I do it manually for each scenario, I'm going to have thousands of blocs (image below is what I have to avoid).
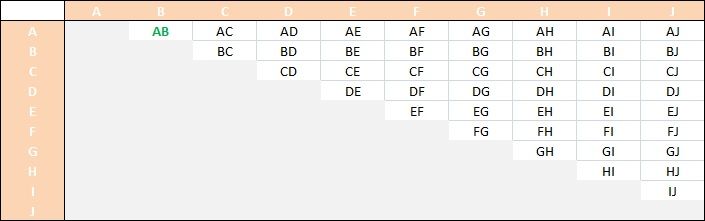
I alsough double checked my first matrix and half of it was useless, as half of the pairs were already present in the top part of the board, so it looks like this now :
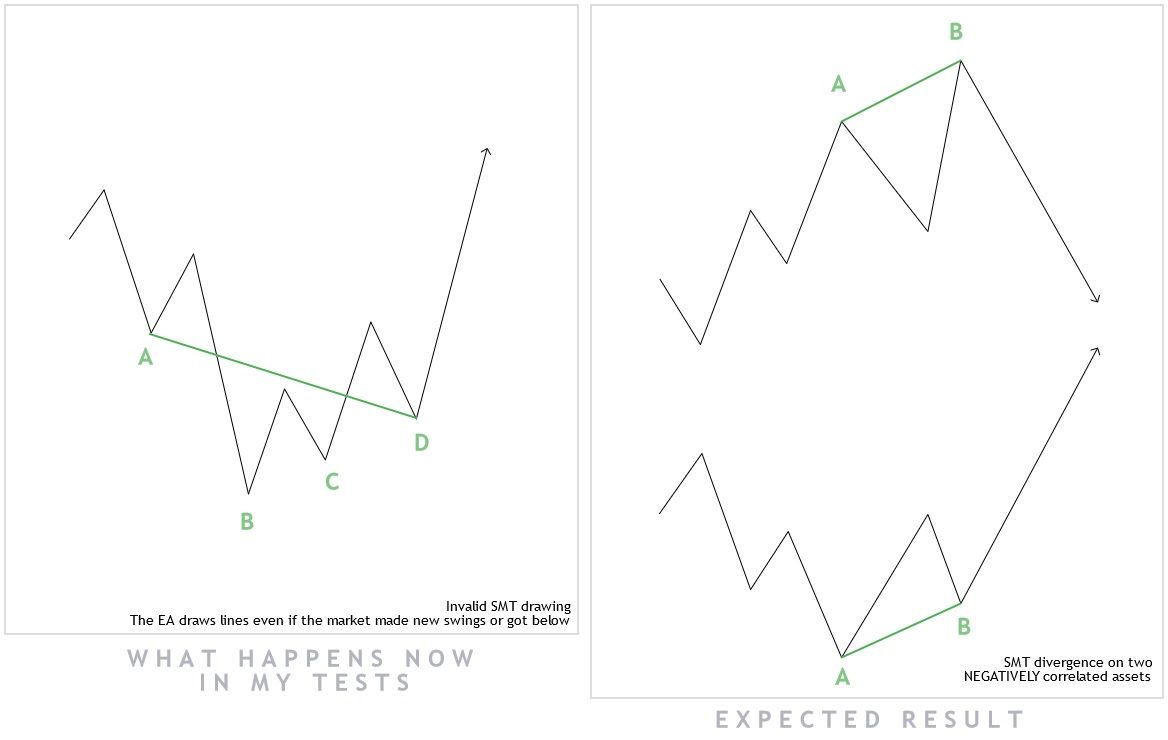
Another problem I have to solve, is : how to make my EA understand that he must not draw any trendline between two points if the market created a new structure between the points ? Like in the image below :
@roar and @jstap do you have any suggestion to solve my situation ? If you need any extra information to clearly understand the actual state of my EA, or anything else, feel free to ask, I'll upload it if needed
Wish you all a good week-end.
-
Working with SMT divergence : how to compare values to trace trendline (the SMT) ?posted in Questions & Answers
Hi everybody ! I'm still working on an EA that will run on the gold. And I'm trying to make it show and use SMT divergences. I know it would be better to use an indicator for that, but I don't have any that does it for me, and I prefer to have it in my EA, it's easier, I can program it as I want it to work, and I have done a good part of the job.
It will requipre some explanations, so I'll explain everything below, step by step. At the end, my current question about what I'm struggling with.
For those who don't know much about the ICT's concepts I'm talking about, here are some quick explanations. For the others, skip this part and go directly to "The implementation" !
SMT divergence
When, on two positively or negatively correlated assets, appear a difference in the price action like, for example, the first makes a higher high and the second makes a lower low, this is an indication that the market has a high chance to reverse soon.
For example : in the current EA, I compare XAUUSD (Gold) with USDINDEX (Dollar Index). They are negatively correlated. This means I have to compare the highs on the first asset with the lows on the second.-
Bullish SMT 1 : if XAUUSD makes a higher low while, for the same swings, USDINDEX makes a higher high, then we have a Bullish SMT Divergence on XAUUSD.
-
Bullish SMT 2 : if XAUUSD makes a lower low while, for the same swings, USDINDEX makes a lower high, then we have a Bullish SMT Divergence on XAUUSD.
-
Bearish SMT 1 : if XAUUSD makes a higher high while, for the same swings, USDINDEX makes a higher low, then we have a Bearish SMT Divergence on XAUUSD.
-
Bearish SMT 2 : if XAUUSD makes a lower high while, for the same swings, USDINDEX makes a lower low, then we have a Bearish SMT Divergence on XAUUSD.
Swings
The definition I use is the ICT's one, made of three successive candles (not five, three).-
Swing high : for three consecutive candles, if the one in the middle has a higher high than the ones on each side, then it's a swing high.
-
Swing low : for three consecutive candles, if the one in the middle has a lower low than the ones on each side, then it's a swing low.
The implementation
So here's what I did : in order to simplify my work, I choosed to :- only work with the last 10 swing high and 10 swing low ;
- ask the EA to draw arrows only if the market structure is identical on the two markets (for an exact candle, it must be a swing on each market) ;
- when 10 swings are marked with arrows (named from A to J), the EA moves the oldest when a new swing appears instead of creating a new one ;
- the loop consists of 10 "creation" iterrations followed by 10 "move" iterrations and then resets and starts again, for both swing high and swing low on XAUUSD ;
- as I can't draw anything on the USDINDEX (as it is not the asset I'm working on), I decided to grab the time and price values of each swing on USDINDEX and store them in variables for each swing, but I'm working on merging this step in the main loop (the left one in the image below), because the time reference is indentical for each swing on XAUUSD and USDINDEX (I only need the price value of the swings on USDINDEX).
For the purpose of this topic, I only show the comparison of the lows on XAUUSD and the highs on USDINDEX, not the other case (highs on XAUUSD and lows on USDINDEX), because I'll just have to duplicate and invert the logic with the correct solution.
This is what you can see in the image below :
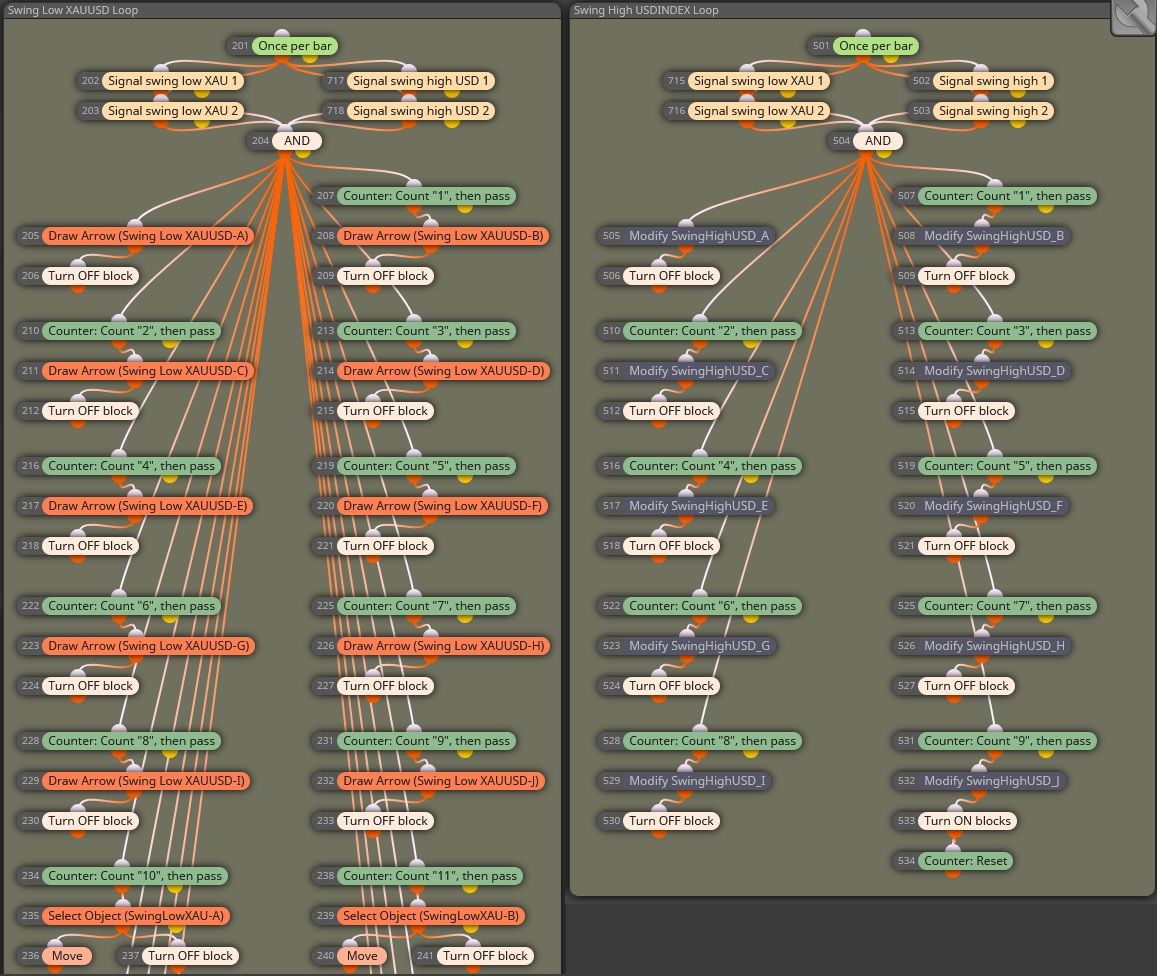
On the left side, I begin with the swing low condition for XAUUSD and the condition for swing high on USDINDEX, so that for every swing low that appears on the XAUUSD chart, there is a swing high formed on the USDINDEX.
Then, the loop : you can see the 10 iterations of the formation of the 10 swing low on XAUUSD (named A to J) and the begining of the 10 iterations that move the oldest swing and place it in the current time when the swing condition is met. The "Turn OFF block" is used each time to turn off the "Drow Arrow" block or the "Move" block of each iteration.
On the right side is the actual loop for gathering the datas from USDINDEX (time and price), but it is not implemented yet (I want to merge the useful part in the main loop, depending on your future answers).
Here's what I used to run the test : a simple comparison between the swing A and the swing B in order to draw the Bullish SMT Divergence.
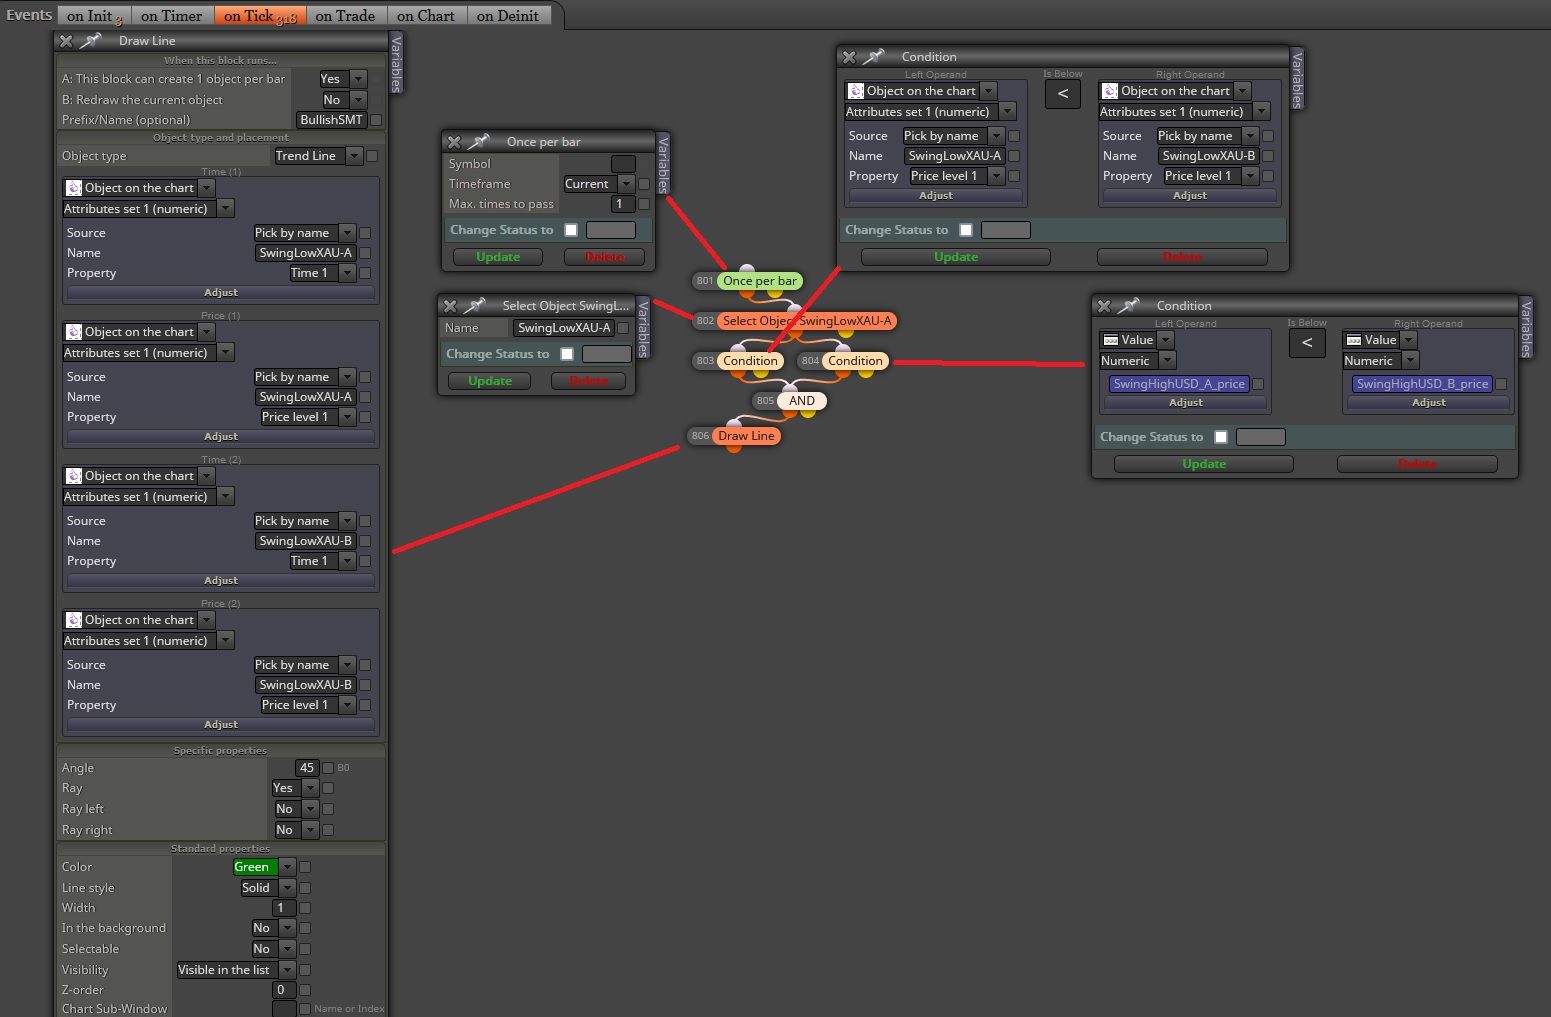
And as you can see below, it works ! I verified that we have two swing high on the USDINDEX at the exact moment of each swing showing the SMT, and it is correct.

Let's summerize a bit...
So now :- I have a working loop that shows me the last 10 opposed swings that appear at the same time on XAUUSD and USDINDEX ;
- I have the datas of these swings in order to push my logic further.
For information...
At the begining, I simply used the "Market properties" / "Highest Price" (or "Lower Price") (Candles period) in the "Condition" block to compare the values : simple and easy. But it is not effective, as it does not recognizes swings and may draw an SMT Divergence from or to a low that is not a swing.The question : how to compare all the values easily ?
Now you should have a pretty clear idea of what I'm doing. I have 10 swing low on XAUUSD and 10 swing high on USDINDEX. I could easily run a test on one case (image above), which is comparing the datas of swing A and B of both markets and conclude whether we have a divergence or not.But : I have absolutely no idea how I could compare all of the values between them, without creating unique comparison loop for each case. May I use a formula ? If yes, which one and how to implement it ? But I am totally incompetant at coding, so I need your help on this part.
Because now, I want my EA to, once per bar, compare every swings between them on both XAUUSD and USDINDEX. The matrix should look like this if I didn't make mistake (in green, the case of the example above) :

Do you have any idea how I could ealisy compare all of theses values (a formula maybe ?), so that, when an SMT Divergence is present, the EA can automatically draw the trendline between the two involved points and validate (maybe a flag ?) the "SMT Divergence Condition" in order to enter in position ? For information, this project is for MT5 (MQL5).
Thanks a lot
I know it's a lot to read, but I hope it will help the community to use SMT Divergences. -