Yes. The fibonacci retraction will be to manually operate these movements when I identify exhaustion zones (accumulation and distribution) in the future and gradually I want to test the automation of some operations with indicators, but I don't have much time or knowledge with fxdreema blocks , but each thing in its time... I will learn!
R
Latest posts made by rafadeggau
-
RE: Difficulty drawing Fibonacciposted in Questions & Answers
-
RE: Difficulty drawing Fibonacciposted in Questions & Answers
@l-andorrà I did not understand your question. I didn't understand the placement of the term "issue". I'm from Brazil and my English is supported by translators. Sorry. Can you rephrase your question?
Now, EA is work correctly -
RE: Difficulty drawing Fibonacciposted in Questions & Answers
It's done! Thanks to everyone who read my question and to @l-andorrà and @tipsywisdom for the tips and guidance
Every day is a learning day
Below is the link to the project
https://fxdreema.com/shared/1KhhqLv2d
-
RE: Difficulty drawing Fibonacciposted in Questions & Answers
@tipsywisdom I will try this week. I do not have time now. thanks
-
RE: Difficulty drawing Fibonacciposted in Questions & Answers
@l-andorrà You are absolutely right. I hadn't thought about it. In this case, I'll have to create another condition to assess whether there is a buy position and another sell position open at the same time.
Do you suggest something?

-
RE: Difficulty drawing Fibonacciposted in Questions & Answers
@l-andorrà Here you are talking about block 18 "formula", correct?
Yes, my strategy predicts a sell and a buy position open at the same time.
The subtraction operation between the buy position and the sell position is to obtain the distance in PIPS of the two positions.
This is the condition for drawing the fibonacci retracement.
My idea is that I manually perform some trades based on fibo levels to average price and try to close all trades (manually) with zero gain and restart the automated strategy. Otherwise (if I can't be present) the operation evolves to the predetermined Stop Loss.
After some testing I intend to automate fibonacci based operations, but for that I would like to draw the retractions on the chart -
RE: Difficulty drawing Fibonacciposted in Questions & Answers
@l-andorrà Thank you very much for your attention, I have to say that I started to strategize a few weeks ago. So I'm not familiar with this language.
I will try to use all the criticisms to gain more knowledge.
I tried to correct all the points you determined, but the Fibonacci retracement is NOT showing on the chart yet.
-
I modified the constants by variables and added "For each trade" above the command string
-
No. I only want the Fibonacci retracement to be erased so a new one is drawn when positions change. I tried to fix this by assigning a Prefix/Name (optional) "fibo" in block 17 and in block 22 I added a filter to exclude everything that contains the name "fibo". Did I do it right? In my mind if I don't exclude the retraction, when the positions change and a new retraction is drawn, the two will overlap and so on, eternally creating tens, hundreds, thousands of retracts...
-
I replaced the constants with the variables
-
-
Difficulty drawing Fibonacciposted in Questions & Answers
Hi my friends,
This is my first post on this site. Initially I give my sincere congratulations to the creator and I could not fail to congratulate all the contributors who help members with doubts. What a fantastic community
Let's get started...
I'm having trouble drawing Fibonacci
My EA ( https://fxdreema.com/shared/z30roDs7 ) works like this:
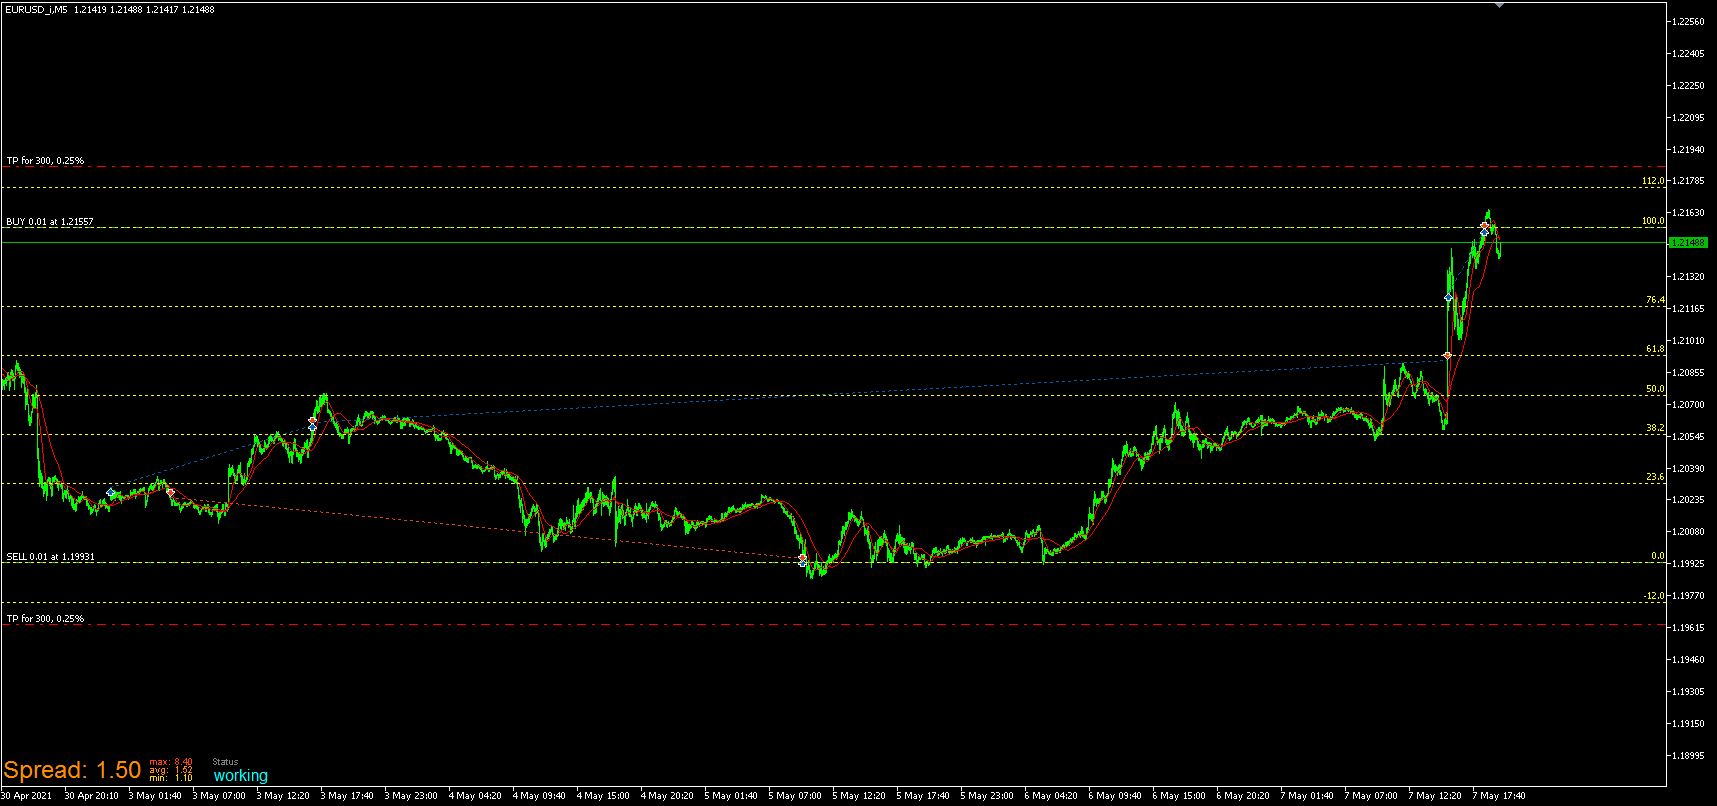
1- If you do not have any open position, a condition is analyzed and if this condition is met, a buy or sell (at market) will occur with SL and TP defined
2- When each order has the SL or the TP reached, the condition analysis will occur again and another order will be executed
This strategy of mine is increasingly moving the opening price of the buy position away from the opening price of the sell position
What I want is that: when an “X” difference, for example 90 PIPS, the Fibonacci lines would be drawn on the chart where the value 0 is the opening price of the current sell position and the value 100 is the price of opening of the current buy position
And also that when executing any new order that changes positions (buy or sell) the FIBO values would be changed and a new Fibonacci sequence redrawn until the SL of any position is reached, then the distance condition between the buy and sell price would be reduced to less than 90 and the Fibonacci lines would be cleared until this variable returns to greater than 90
Thanks