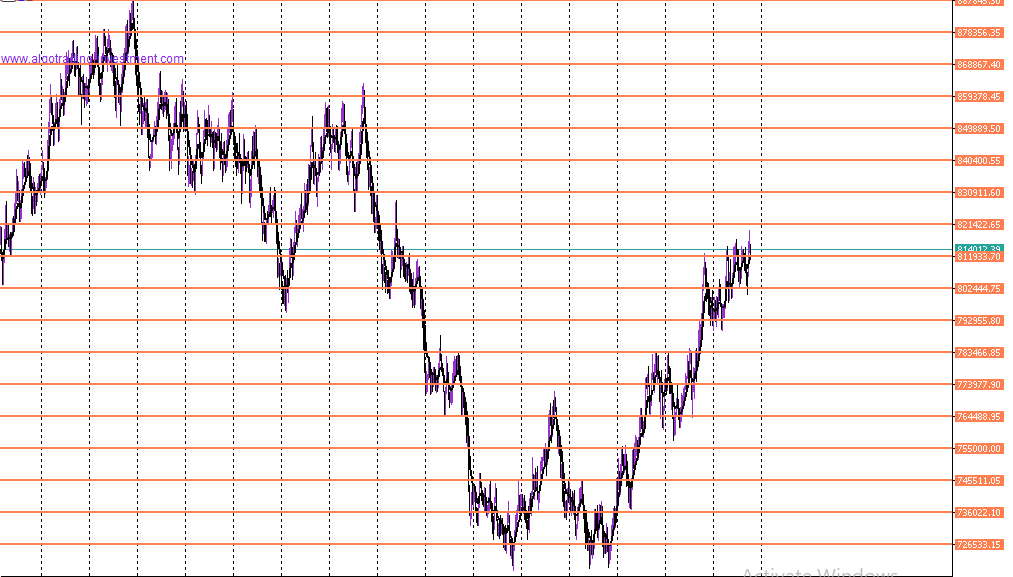
Good Day Guys, I would like to know how can i make an EA or Indicator that draws 10-20 Horizontal lines on a chart on a specific timeframe!. The lines will be calculated by the Gap in-between the price stated on the "vertical scale" (The numbers located on the right side of your chart.
As you know, those numbers on the vertical scale change per timeframe. So i would like help on coding an EA/indicator that just plot those horizontal lines determined by the timeframe you set it to. Similar to the "Time range separator" but horizontally instead of vertical, so basically the Indicator/EA will plot the Horizontal line on the values shown on the right side of the timeframe, depending on the timeframe.
This would be very helpful and i am willing to sign a contract with the person who helps me to go 60/40 on the indicator because i will be making it commercial and ready to sell in the market as i have traders who are willing to help promote the indicator as soon as i have created it, not to mention my own student portal on Telegram.
Thank you.
Example of how the Indicator should look