Question about strategy tester and objects on chart.
-
Hi all,
If I have a support and resistance indicator that plots objects on the chart and I use those objects as signals/areas/prices in my fxdreema project, what happens when I backtest the project in the MT5 strategy tester (with visualisation turned off)? Will the tester be able to access those objects? If not, what can I do to enable me to backtest it?I don't have anything created yet. Just needed to know before I start.
Many thanks
B -
Yes - object line draw is show zone on high and low before crossing candle/price this zone on backtest in tester strategies MT5
-
If ea is using the objects (not the actual value) then it will only work in visual mode.
-
@jstap said in Question about strategy tester and objects on chart.:
If ea is using the objects (not the actual value) then it will only work in visual mode.
Thanks jstap. The indicator is in the indicators folder and the objects would normally be on the chart, but if visualisation is turned off, there is no chart. The EA would be pulling the value from the object using "for each object" blocks and check distance blocks. Does that make sense?
-
Yes, You can test to see if a small EA does something on non visual backtest
-
@jstap As expected, it did nothing unless visualise was turned on. Question. If you have multiple rectangles on the chart, all the same colour and same name prefix, how does the EA know which one it is reading price coordinates from?
In this tutorial from Miro, he is taking the price coordinates from a support/resistance rectangle. But his "for every object" only filters by "rectangle" and name prefix. So there are multiple rectangles on the chart that have the same properties. So how does the EA know which one to read the coordinates from? Nearest one? Furthest one?
https://fxdreema.com/forum/topic/4209/tutorial-07-read-prices-from-indicator-objectsP.S. I bought your book. Amazing work mate! Well done.
-
I can give you a breakdown:
Tree 1
block 100 - 106
looks for a name doesn't care for other parameters
block 113
checks if a bool constant is false
block 102
checks if selected object price is above candle 1 close price
block 142
if all true sets price 1 variable to object price
block 103
checks if selected object price is below candle 1 close price
block 143
if all true sets price 2 variable to object price
block 140
sets the zone width variable (hi-lo=distance)
Block 141
checks if zone distance is greater than ATR value
block 116
sets bool variable to 1 (true to start next tree. Using custom code)Tree 2
block 117
Checks if bool condition is true
block 118
checks if price 1 variable price is above candle 1 close
block 108
checks if there is a buy trade
block 105
if no buy trade buys now
blocks 119, 11, 111
does the same as 118, 104, 105 for sells
Block 120, sets the bool condition to of after completing all above.I hope this has given you some clarity on how Miro's EA works
-
Thanks for that. So basically because of the way that ea works, its looking for price to be between two object price lines (i.e. inside a rectangle) and then waits for the break above. But, what if I wanted to AVOID trading near rectangles (S&R areas)? So I would be buying normally, but if price came within x pips of a resistance rectangle it wouldn't be allowed to buy. And if I was selling normally and price came within x pips of a support rectangle, it wouldn't allow sells.
Basically I'm trying to avoid buying into resistance and selling into support.
-
->above or -<below those lines would be out of the S/R rectangle
-
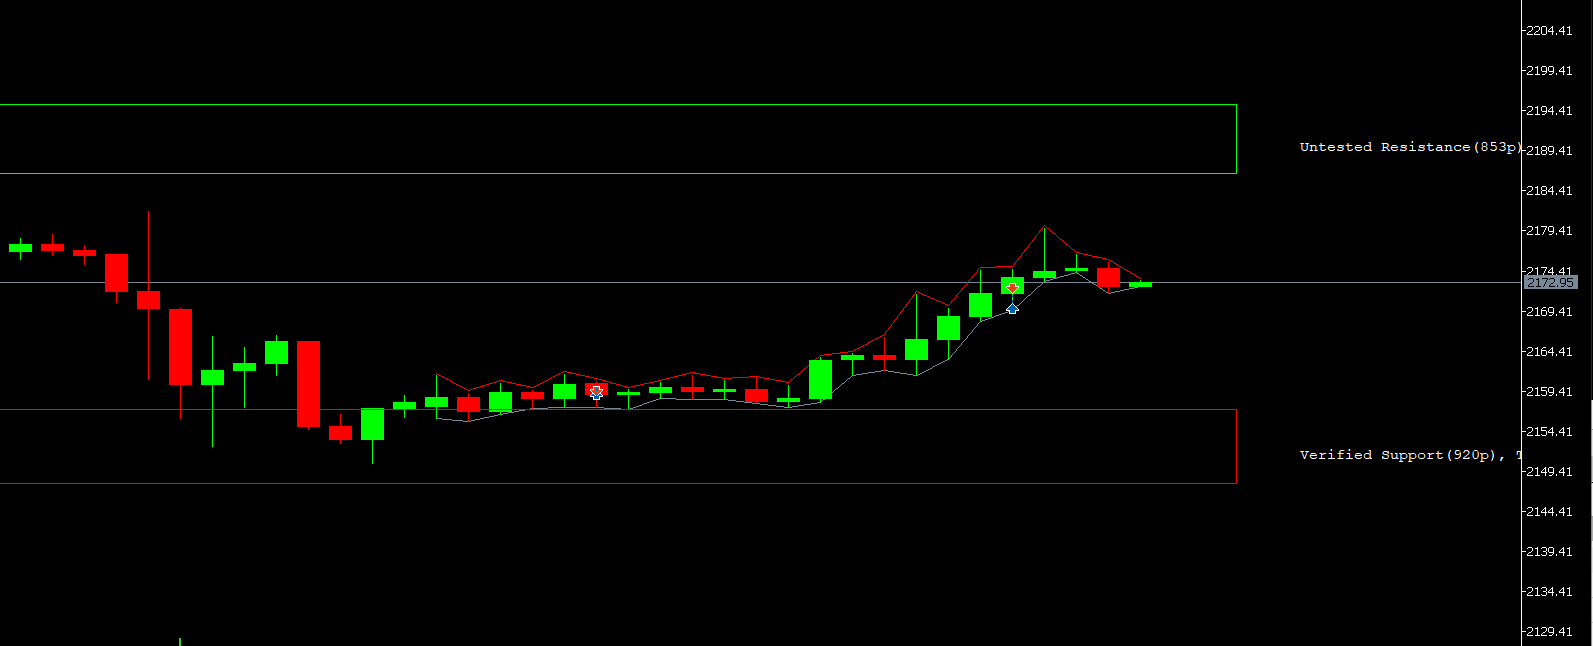
Still having issues. Could some kind soul have a look at my project and see what I'm doing wrong? I just used a basic RSI crossing level and 200 MA for trend. The rest is for the support and resistance objects. As you can see in the screenshot, its still taking trades right by the S&R levels, despite me putting the minimum distance from them as 10000 pips (just to ensure no trades are taken).
I'd be very grateful if you could steer me in the right direction.
Thanks
B
The indicator I'm using is this one. I've set my colours to lime for resistance and red for support.
SR.ex5https://fxdreema.com/shared/wak18GDxe
-
Are you sure the indicator is not repainting. I'm afraid thet is the problem.
-
I'm not sure, but I do know the first trade was taken right after the red support rectangle appeared. That trade should not have happened because it was way too close to the rectangle.