Need Guide! Fractal Histogram
-
Hello Experts.
Please guide how can i trade only when the value of fractal histo = 16 from attached indicator.
Thank you.0_1576638524157_fractal32histo.mq4 -
Could you please share the link of the project instead of ofering the mq4 file? That would be easier for everyone here to look at your issue?
")
-
I've tried, but failed.
Please import the file attached.0_1576772399371_fxDreema.mq4 -
Really? How did it fail? It works fine for me.
-
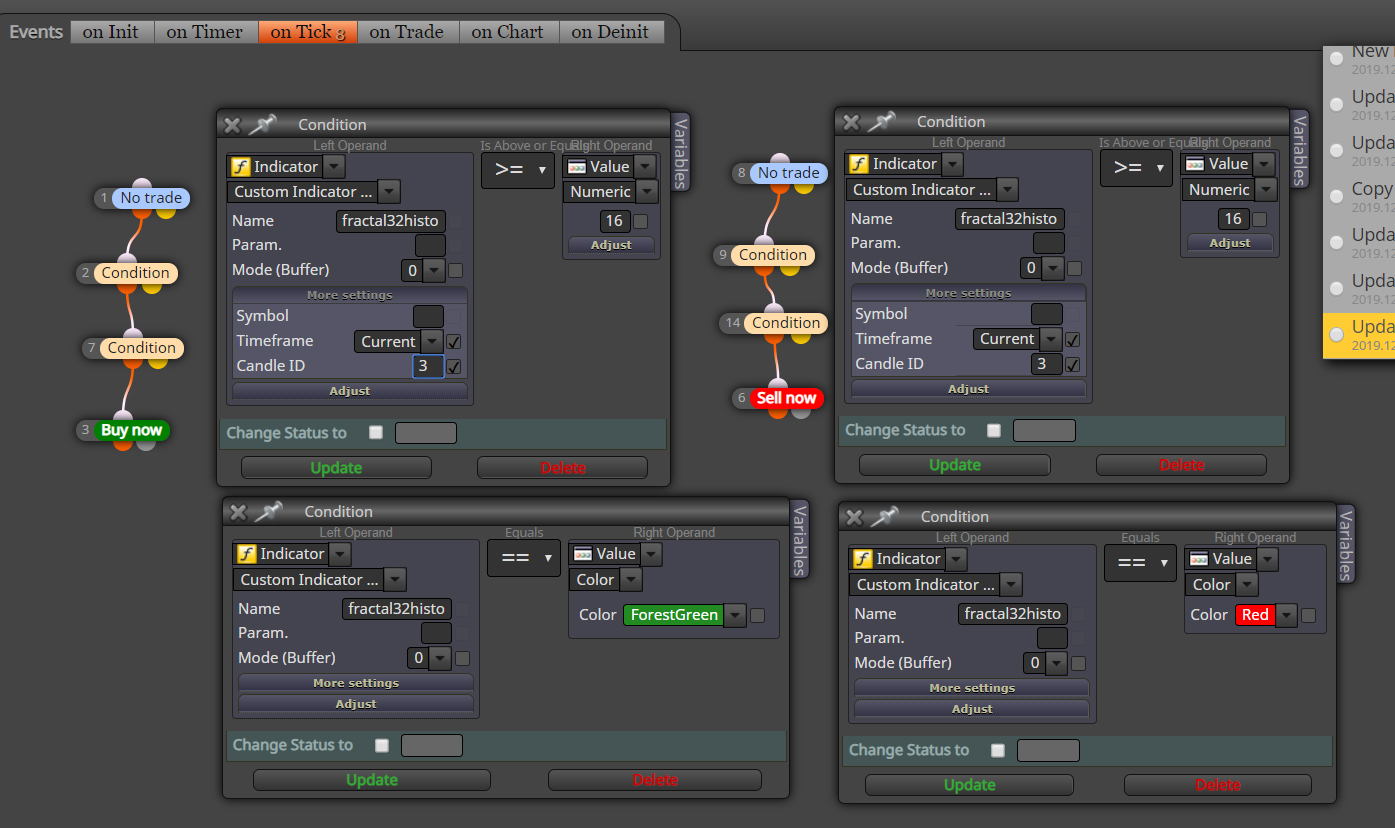
Hmm...i'm not sure if i attached the wrong file.
Here i attach again with screenshot from fxdreema builder page.
From strategy tester it only have alerts but no trade. -
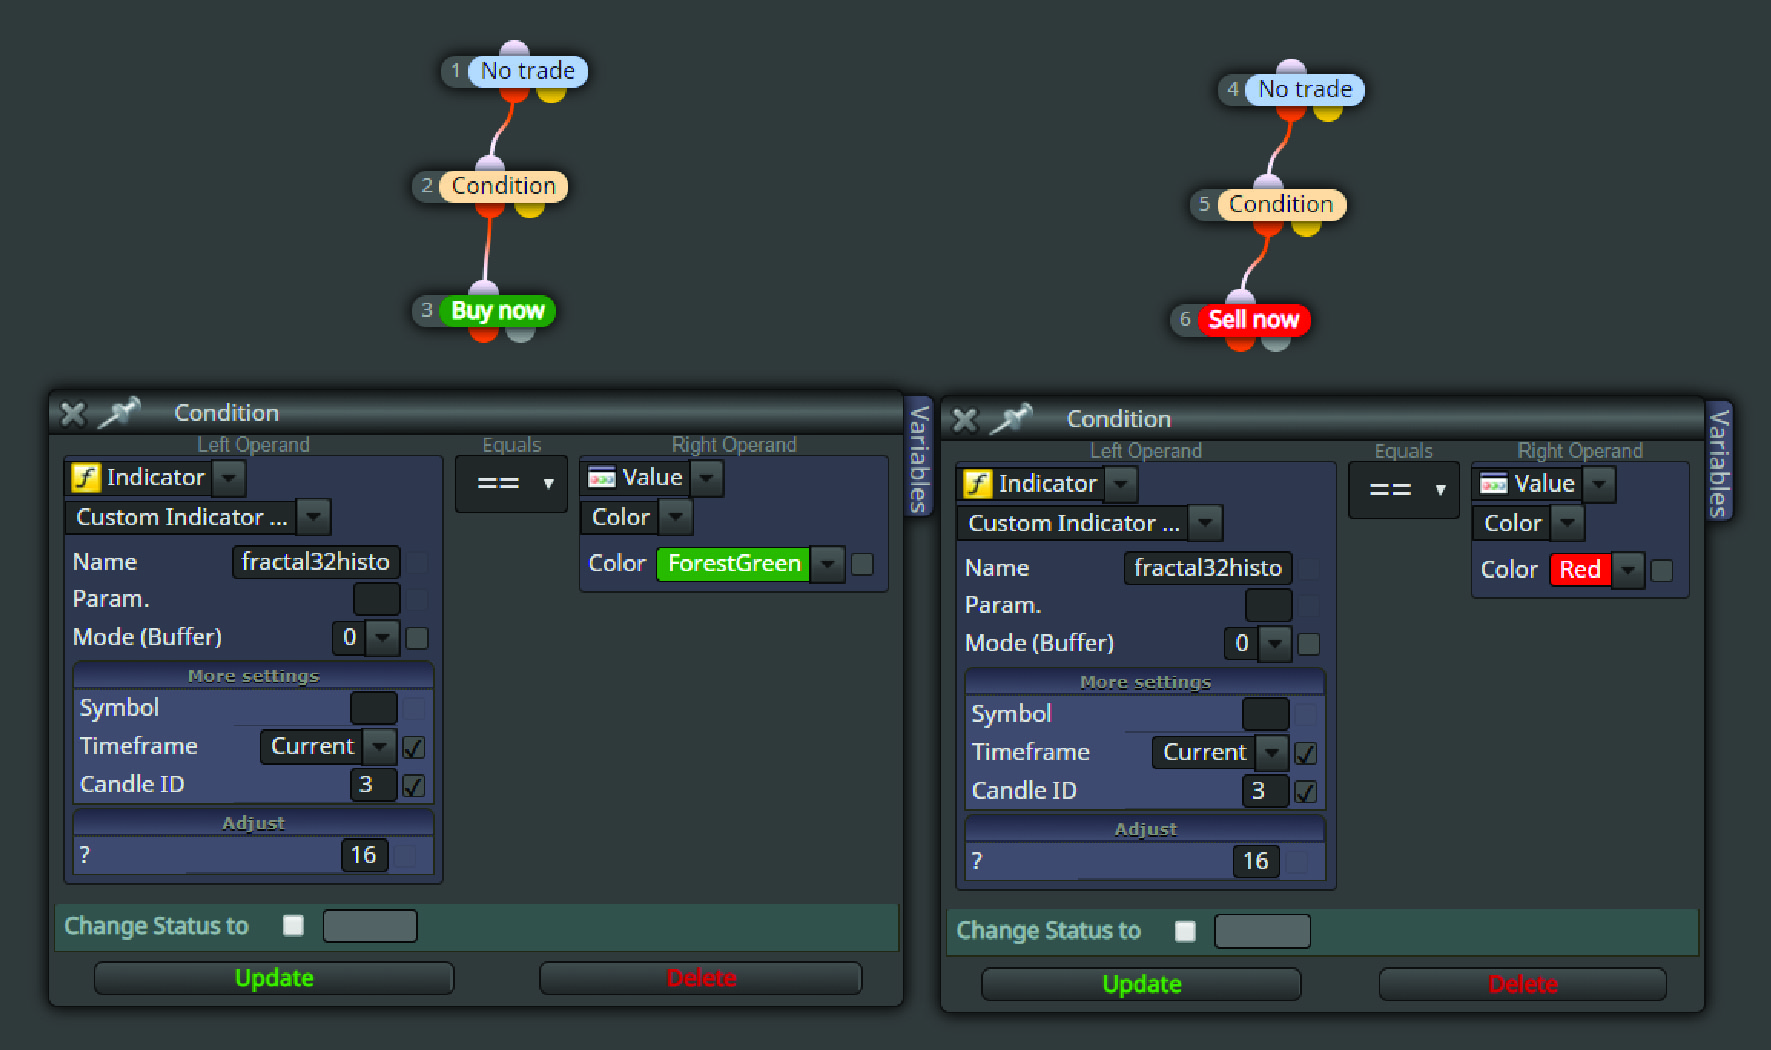
@biztet Check your condition blocks!
First you adjust each value by the indicator to 16. And then you check if 16 == green, which will never be true.
Remove the adjust and set the right side to value >= 16
-
i've tried that one. but then how to set green buy red sell? because the value of green and red both same = 16.
-
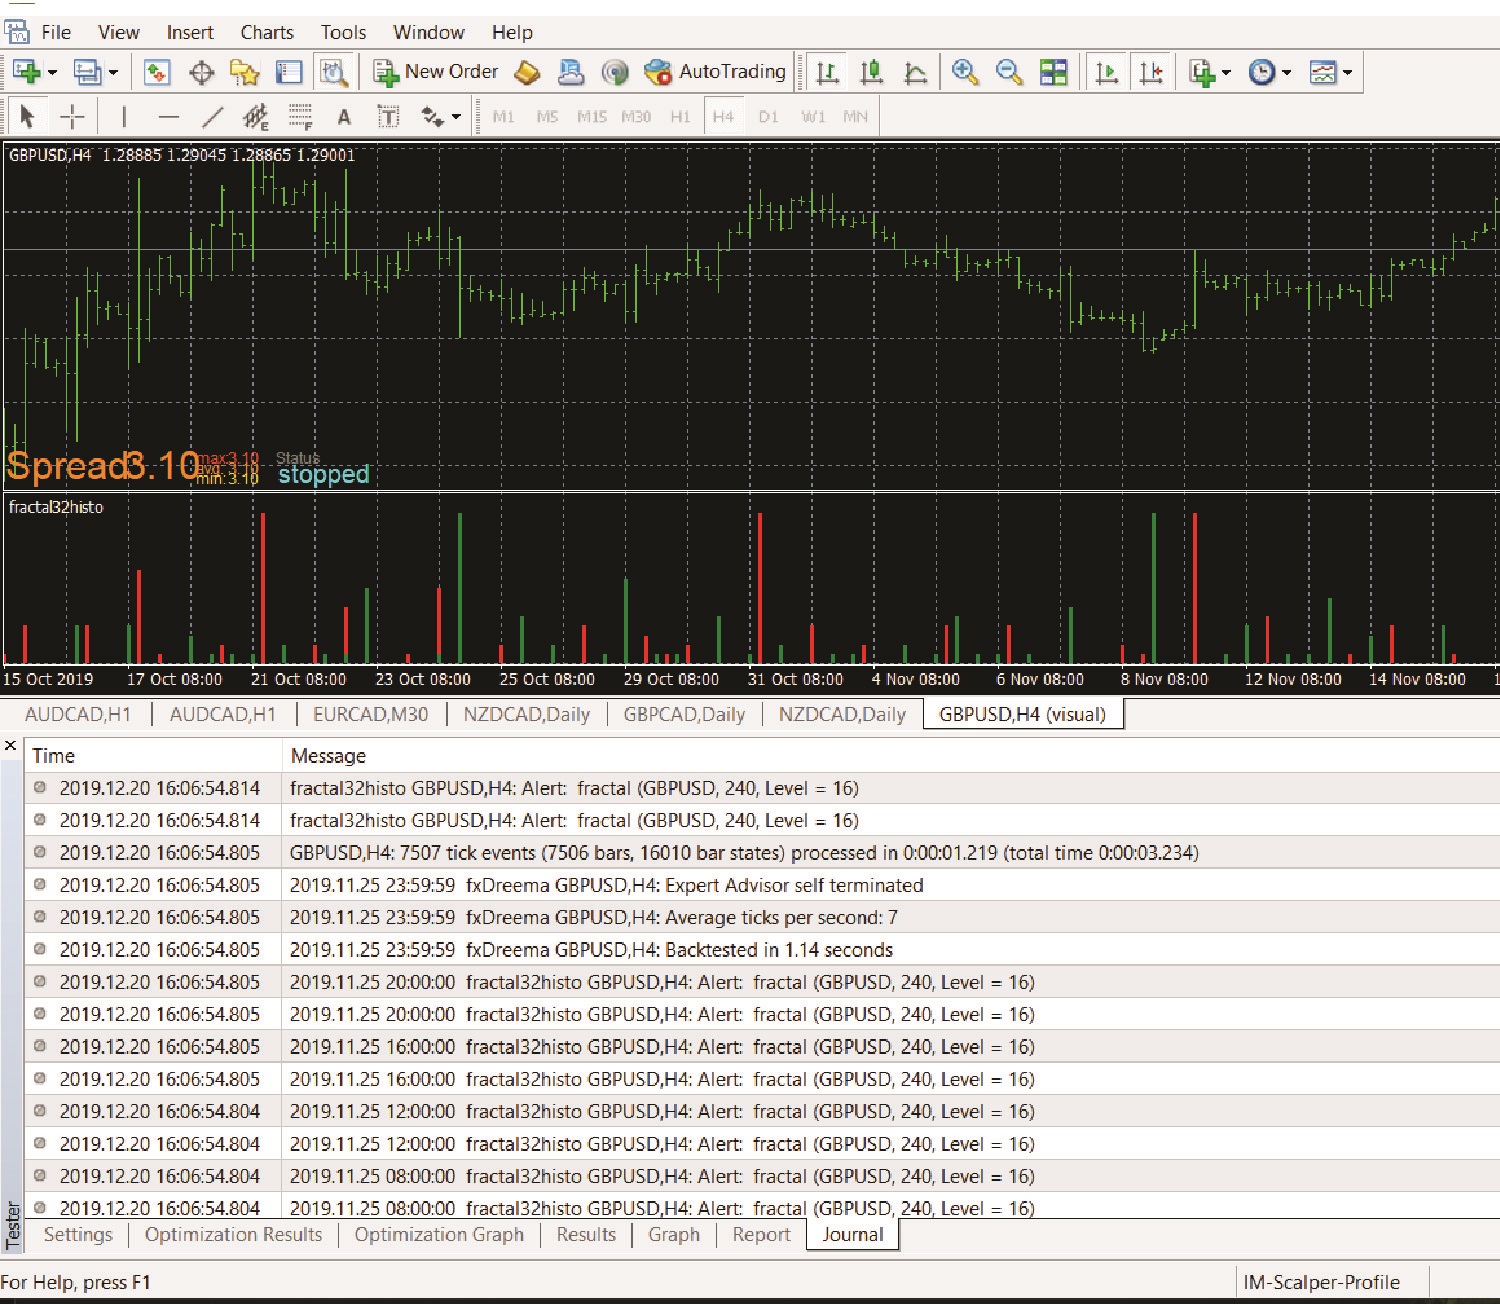
I tried this, but also doesn't trade, only alerts.
-
@biztet I tried to build the project to make it work, but there must be some strange thing wrong with your indicator as my EA only opens sell trades. When I back-test the indicator only, it also produces only sell signals.
If you place it on a chart the result is different.
However, for the condition block, I just took those ..
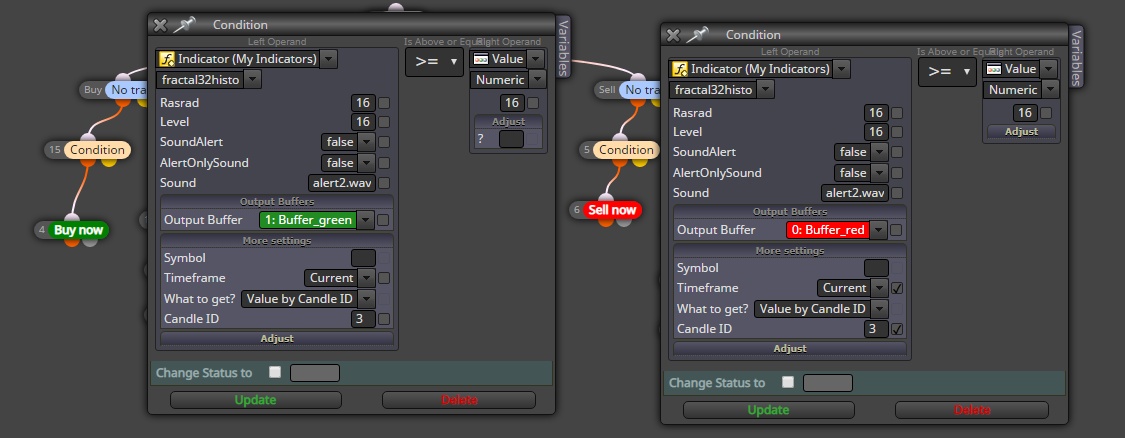 https://fxdreema.com/forum/assets/uploads/files/1576864393628-untitled-1.jpg
Sell trades work fine somehow. I also saw sometimes that the indicator shows both buffers to be 16. so maybe need to check each others values as well.
-
Wierd haa..
is it possible to modify the indicator mq4 to change the output into something else that we can differentiate between buy/sell signal? -
@biztet I did some modifications already and managed to get green and red signals in backtest. Than I noticed that going back on candles doesn't work well. So I also removed the empty value statement. Hence both buffers will have a value everytime. However, the results are still not satisfying. Finally I seeked help from Mr Google and ended up with this project, which fascinated me that much that I forgot about your issue - sorry!
-
Quite interesting about the MC Fractals.
But can it be use to make my Fractal EA because i don't really understand that indicator and how to read the signals. -
@biztet If I will find the time, I'll make a prototype EA. The fascinating thing is the good risk reward that you can achieve. I tested visually an 1:6 risk reward was not so rarely.
Read the PDFs I'll focus on 2 timeframes for begining. -
Great! I will also try to understand it.

-
@trader-philipps , do you understand the MC indicator strategy? sorry i didn't. please guide. tq.
-
@biztet Well, I think I do. Did you read through all PDFs?
Basically the higher TF gives the trend direction. Than you try to enter the market in the same direction on price pull backs giving you a good risk reward opportunity. -
Actually that is exactly what i'm trying to do, only that usually the fractal are just like zigzag, 2 candles behind.
I'm thinking of using H4 fractal to open trade and close on M30/H1 opposite fractal. Logically just to get the direction and close in the middle of the way.
What do you think? -
@biztet Here is a short explanation of the incators:
- Wave structure on chart:
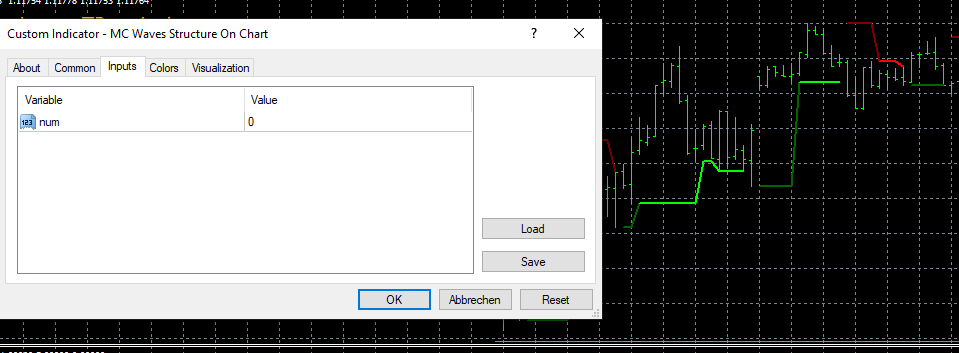
Parameters:
num -> timeframe where 0 is the current chart timeframe 1 is the next higher and so on.Use it for determine your SL for instance.
- Fractal Studies:
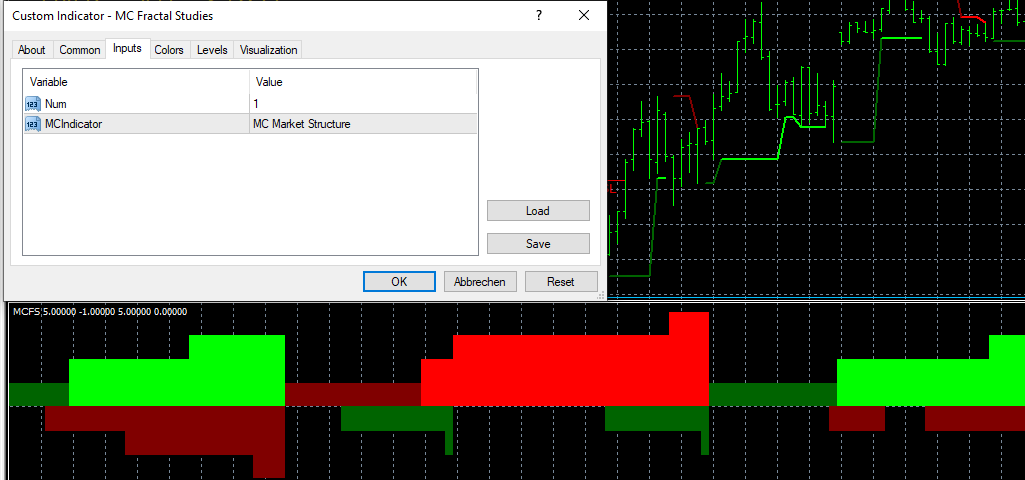
Parameters:
num -> same as above
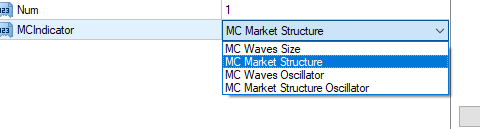
MCIndicator: Defines indicator style.
I usually use the MC Market Structure chart type.
Green above 0 -> Uptrend
Red above 0 -> DowntrendGreen above 0 and crimson red below 0 -> Uptrend with pullback
Red above 0 and dark green below 0 -> Downtrend with pullbackThe idea is that on higher TF you watch for trend. And on lower TF such as current you enter the trades.
If you like an oscilator view better, you might choose Market Structure Oscilator rather than the regular one.
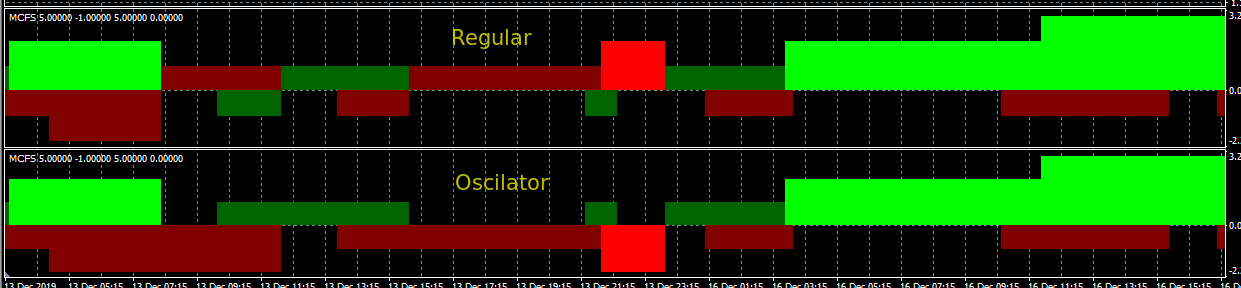
The information it gives is the same. Just the red / crimson information is below 0 on the oscilator view.
The Wave Size chart you might use for instance to compare it with current ATR. Only take trades for instance if Wave size is bigger than ATR(14). Hence you might filter some low moves out. Here is a visual example where I manually put ATR(14) indicator on Wave Size chart.

- Wave structure on chart:
-
Thank you very much for the explaination. I'm weak in understanding this kind of indicator.
Anyway i'll try to understand it or else i'll use stoch instead with the same strategy. For that i guess i won't get the best entry, the pullback candle.
But sincerely i don't know how to use the ATR for SL. Can you help me with that? -
@biztet ATR SL is one of the topics that are asked maybe 1-2 times at least per week. You might use the search function or maybe have a look here.
If you use the Fractals on Chart indicator, you may not need it as the indicator sets it's stop level at the last fractal. You may add a pip for spread and commision if applicable.