Mark with numbers the previous tops and bottoms on the graph ???
-
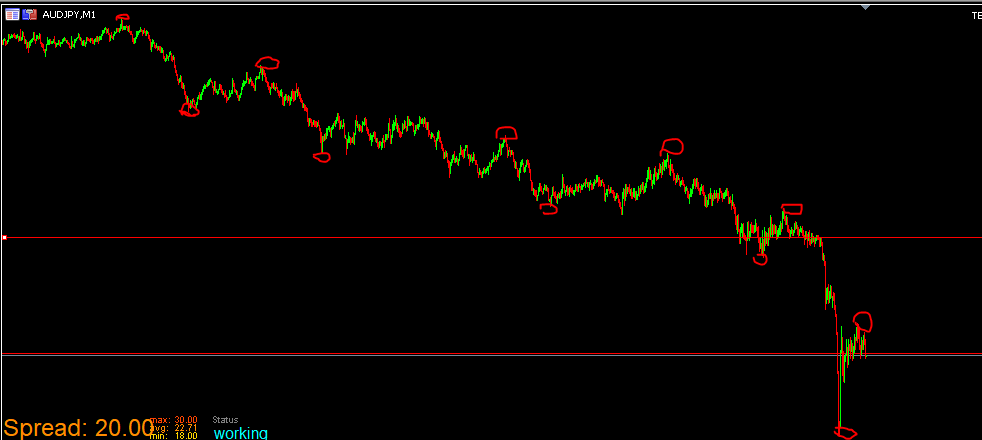
I would like to somehow identify what these tops and bottoms are and put some marking on them, it can be random numbers, 1,2,3,4,5,6
-
@miro1360, @l-andorrà, @trader-philipps Can you provide me with any help to achieve this goal?
-
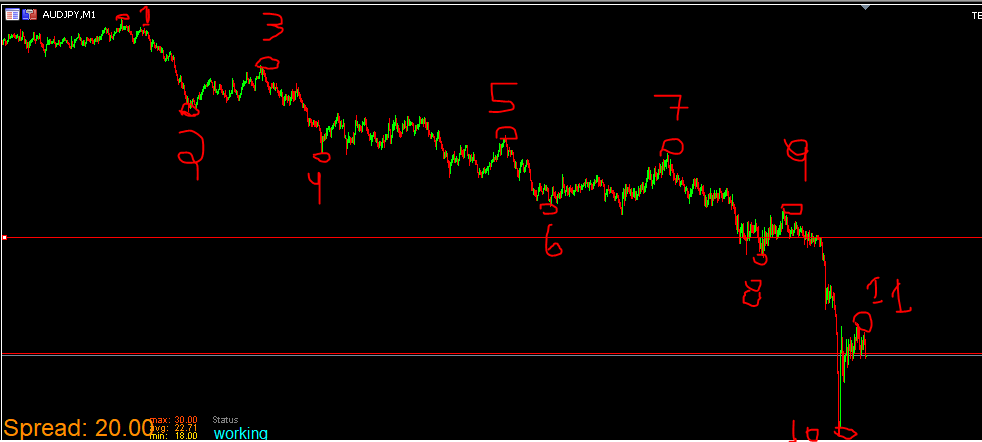
I would like these numbers to be created automatically and randomly on the graph.
I would have to define a period for example:- Check the last 55 candles and check at random as follows:
Odd numbers following 1,3,5,7,9,11,13 should be displayed on the Tops.
Even numbers following 2,4,6,8,10,12,14 should be displayed in the Bottoms.
- Check the last 55 candles and check at random as follows:
-
Not a trivial thing to do. Identifying tops and bottoms visually is one thing, but finding an algorithm doing that automatically is a completely different story. Would the zigzag indicator be useful in your case?
-
@l-andorrà said in Mark with numbers the previous tops and bottoms on the graph ???:
Not a trivial thing to do. Identifying tops and bottoms visually is one thing, but finding an algorithm doing that automatically is a completely different story. Would the zigzag indicator be useful in your case?
good idea, i will try, but and about print number on top and bottom automatically, you have suggestion, or example to share with me?
-
zigzag, or envelopes could be less demanding
-
@miro1360 said in Mark with numbers the previous tops and bottoms on the graph ???:
zigzag, or envelopes could be less demanding
I am not able to understand how to set up a condition so that a number is plotted or write something on the tops or bottoms that the zigzag indicator finds, and the worst thing is that I am also not able to do something so that the numbers are in the sequences I want .
Can you help? -
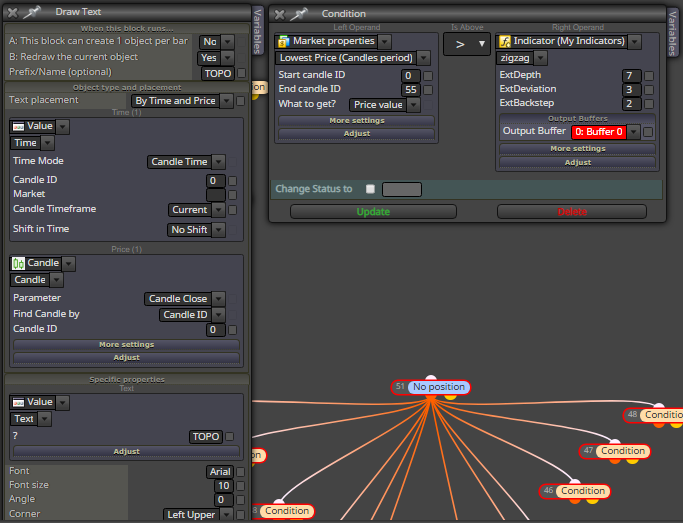
You can use this block with this settings to draw the high of a candle.
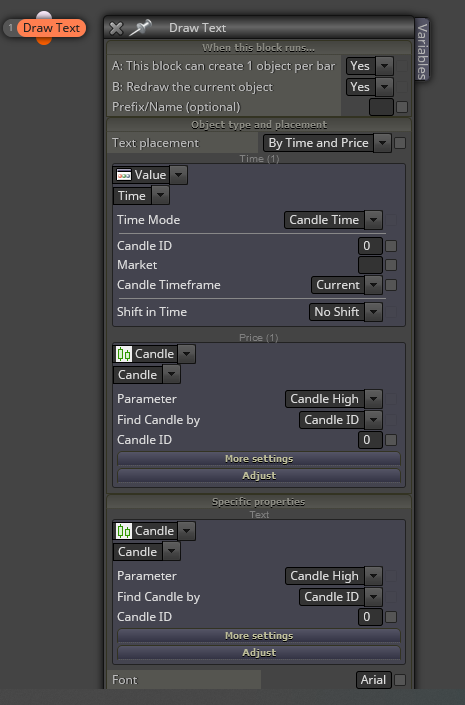
Then use another one for the lows.
-
but, where am I going to put the sequence of numbers? I saw that it is a block of text, but if I configure exactly the way you said I will have nowhere to write the number, in reality I want that whenever a new top is identified an even number is placed on top of the candle that formed the top.
If a new fund is identified, an odd number is placed below the candle that formed the fund. -
@l-andorrà but, where am I going to put the sequence of numbers? I saw that it is a block of text, but if I configure exactly the way you said I will have nowhere to write the number, in reality I want that whenever a new top is identified an even number is placed on top of the candle that formed the top.
If a new fund is identified, an odd number is placed below the candle that formed the fund. -
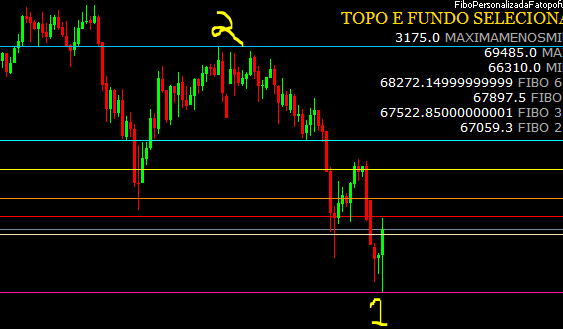
The BLUE line is my variable defined as "MAXIMA" it is adjusted whenever a candle breaks its value, so when a candle breaks it will adjust itself forming a new maximum, if the candle just touches it without pushing it remains in the price .
When a candle touches and pushes it will form a new maximum, when the candle finishes pushing this line and does not push anymore I want a number to be placed on top of it naming it. -
@l-andorrà @miro1360, @trader-philipps
Hi friends, I managed to put the text at the height I need and make it follow the line, but now as shown in the image I want this text to be on top of the line above the candle that corresponds to MAXIMA.
The same thing I want to do for the bottom, put the writing under the candle. How do I do this? -
Are those numbers supposed to be over/above a specific candle? According to your screenshot, numbers 1 and 2 are on max/min of zigzag legs. They will change over time. Maybe you can identify those legs and then write the number there.
-
@l-andorrà said in Mark with numbers the previous tops and bottoms on the graph ???:
Are those numbers supposed to be over/above a specific candle? According to your screenshot, numbers 1 and 2 are on max/min of zigzag legs. They will change over time. Maybe you can identify those legs and then write the number there
Yes,
Even numbers above the candle that formed the new top.
Odd numbers below the candle that formed a new fund. -
But do they coincide with zigzag highs/lows? AFAIK you can draw numbers on top of candles, and not above/below horizontal lines.
Can someone please correct me?