Motivation results
-
Motivation Results
-
Hi all,
I am a bit stuck with my EA, and it seems like most can create perfect EA''s, but when it comes to results/performance its quit.
I don't ask to drop your "Profitable" EA, but please when you have a good performance show the "Live" result. For example: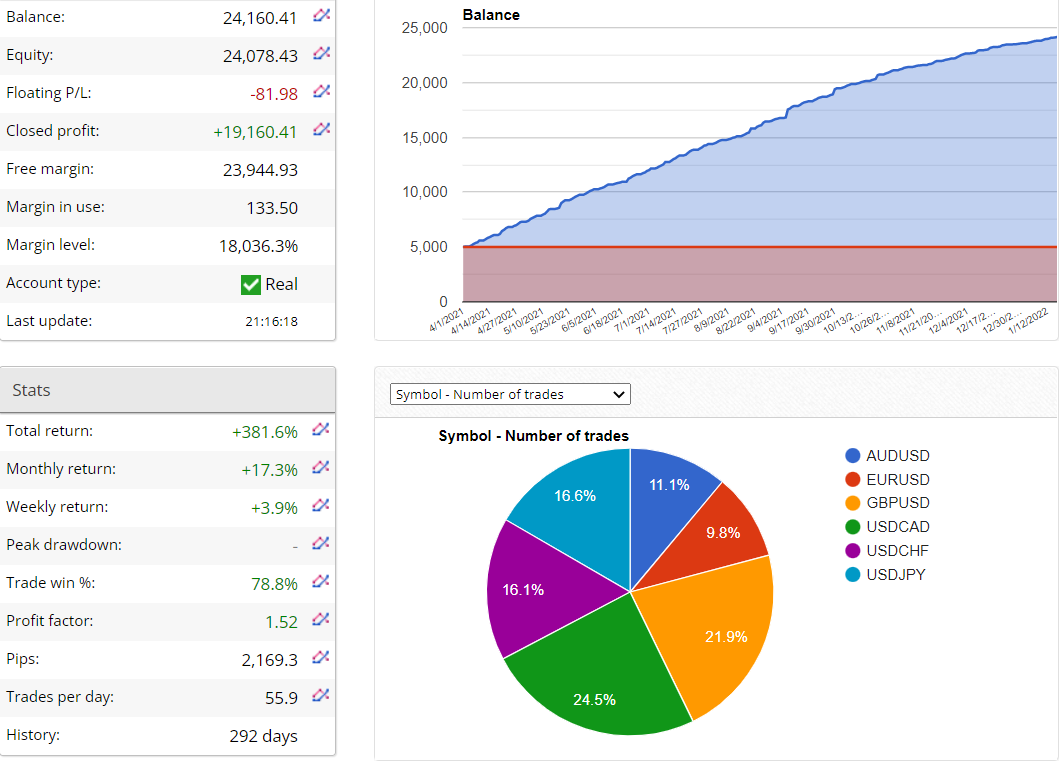
-
@chikano11 I don't understand my friend, is this a result of mql5.com or myfxbook?
-
@chikano11 This is a really really cool idea!
Like this, people can get more motivated!
Loved this idea! -
@chikano11 said in Motivation results:
Hi all,
I am a bit stuck with my EA, and it seems like most can create perfect EA''s, but when it comes to results/performance its quit.
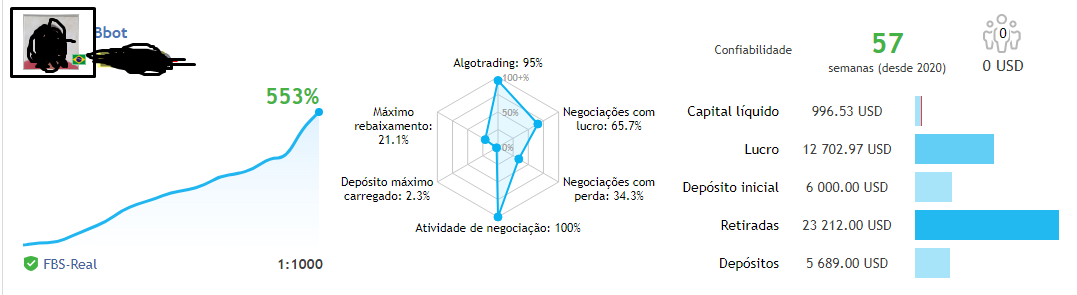
I don't ask to drop your "Profitable" EA, but please when you have a good performance show the "Live" result. For example:By the way, by reading your awesome balance growth curve, I can tell by the concavity of it, that the system has a really cool winning strategy, but it is missing out on managing the lot size. It could be upgraded by using some of the FX Dreema tools for money management, to convert this curve into an exponential growth curve.
-
@ontradingx
Hi,
This is an FXblue account.
I prefer it more then myfxbook
-
@quantengineer
Hi,
Definitly it is almost to good to be true.
It is a hedging system which has a drawdown of 65%... Way to high, but still going strong hahaIn my opinion with hedging or martingale is that if the account has been doubled, take 50% and let him run again.
So even if the account blows up, if you took multiple times the 50% you still have profit.
Ps. Its not my account, but I also got the EA.
-
@chikano11-0
I really like this strategy profile and I currently use a real account robot that I am satisfied with and uses some similar elements to yours. -
To estimate a strategy performance, you should always look at the equity, not the balance. The balance curve hides every drawdowns that happend while positions were opened. For exemple about this specific account (Bbot) :
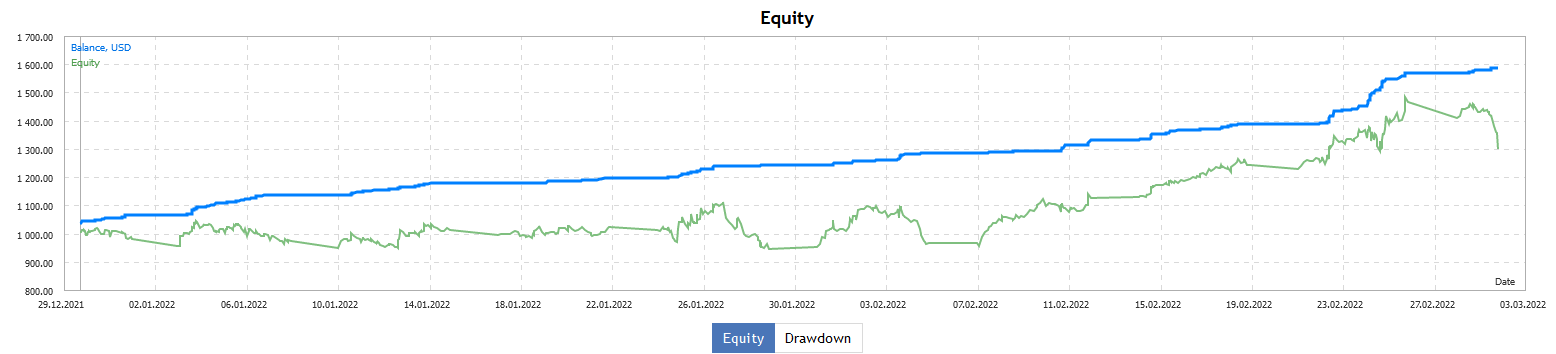
Apparently if the balance curve is constantly increasing, but the actual situation of the account doesn't look good(on the period). The profit/risk ratio of the equity curve(green) is close to 1, as much as if you traded randomly.This :
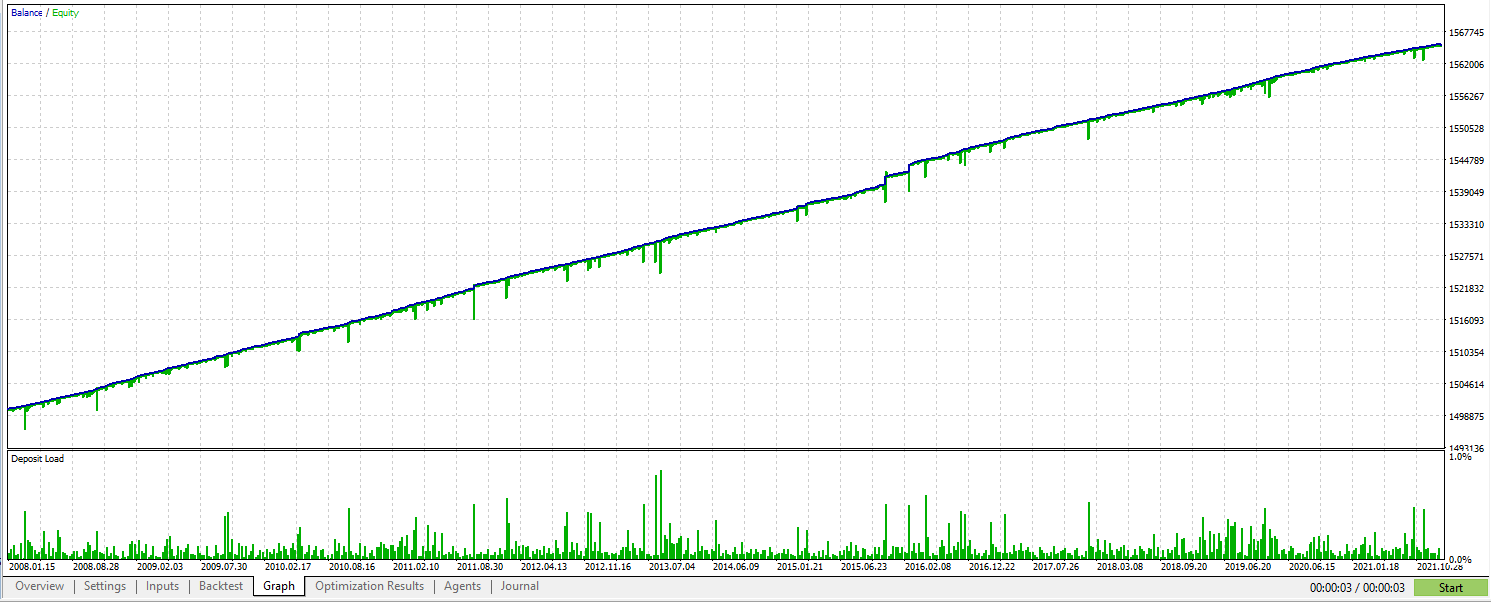
is the backtest result of mine, focusing on the green line, see that the profit/risk ratio is much higher, close to 10. -
@seb-0 Impressive results!
 Can you tell something about your strategy?
 ")
-
@l-andorrà
I use reversal strategy with the rsi indicator only, with a cumulative approach.