Draw Rectangle
-
If I have say a support level and a defined zone above and below, how can I draw a rectangle (object) on my chart that covers this zone?
I thought I could use Draw Shape but don't seem to be able to get it to work?
I have two variables, one being the upper boundary of the zone and the 2nd one being the lower boundary. E.g. on the audusd it might be UpperBoundary = 0.7560 and LowerBoundary = 0.7520. Can I use these to draw the zone?
-
Does anyone have any suggestions for this?
I am simply trying to draw a support/resistance zone where I have the upper and lower boundary of the zone. I can draw a line at the upper and lower boundary but would like a way to represent it as a shaded zone rather than just showing the lines?
-
For rectangle you need to provide 4 values - 2 price and 2 time values. Those are the coordinated of 2 points on the chart. Imagine that you are drawing it manually - the first point is where you started drawing it, and the second point is where you stopped.
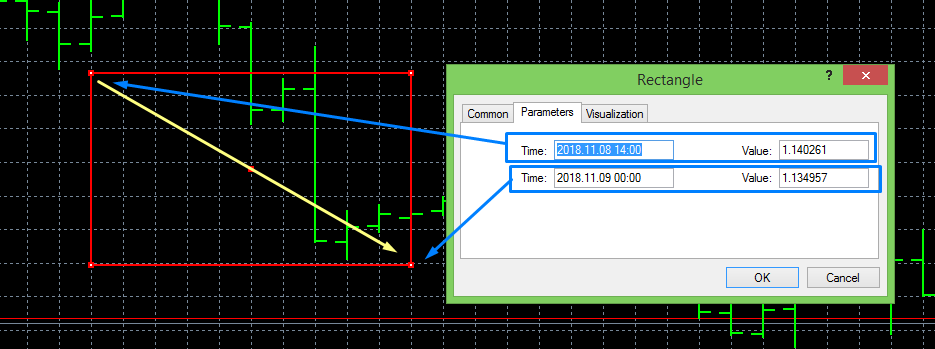
I started drawing this rectangle from the upper left point, as the yellow arrow shows.