To optimise set the lots as a constant:
Do you mean the % level used for each fib level?
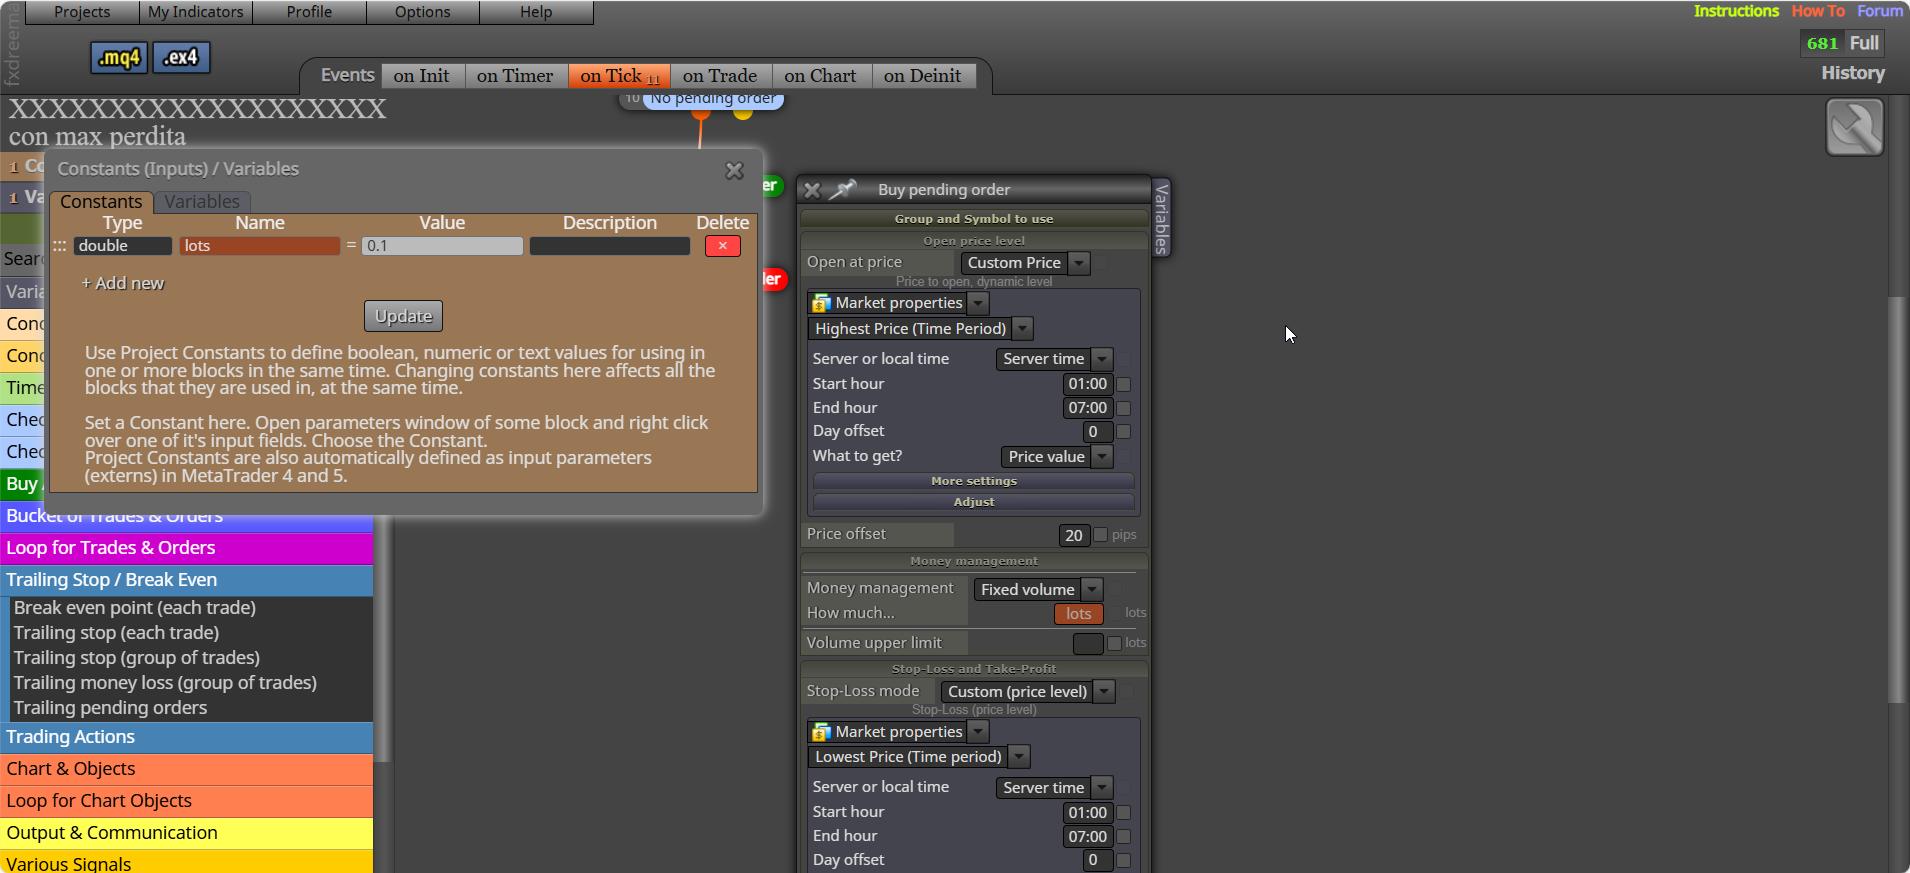
highest or lowest price from market properties using time adjusted by + or - 1 pip
It should work, add a shared link to see what you have done.
It is not easy to trail by money, is easier to trail by pips
@ellemitless Not sure exactly what you want, but if you use the stoploss as the trail start, then trail won't start until price is as far away as the stop is
@Vishwa Start a fresh question for this, rather than on someone else's thread.
This will probably do it, under the condition is where you would do something like place a trade.
https://fxdreema.com/shared/gsxiiKgZc
No that you save and call every time you need to update, generally they will be remembered every time you restart the terminal. name a template the same as the EA and on backtest template will load.
use the name - modify variables with line name using object on chart
I don't think you can, if you have the .mq code for the indicator you could ask AI to add a buffer with the candle ID, without this reference there is not a lot you can do.
I asked ChatGPT to translate and asses. On a personal note, Gold is generally bullish, so maybe cut sells entirely, but seems to work, now set it on demo and painfully watch to check account results are same as backtest (probably will be as your stops are sensible).
Here’s the full translation of the trading report from Portuguese to English:
 Trading Report Summary
 Account Performance
 Drawdown Metrics
Balance Drawdown:
 Risk & Return Indicators
Trade Statistics
 Trade Outcomes
 Strengths
• Net Profit: £1,187.23 on a £10,000 deposit is a solid 11.87% return.
• Profit Factor (1.43): Indicates the strategy earns £1.43 for every £1 lost—respectable, though not elite.
• Sharpe Ratio (2.53): Excellent. Suggests strong risk-adjusted returns.
• Drawdown Control:
• Max equity drawdown: 2.44%—very low, showing tight risk management.
• Max balance drawdown: 1.97%—also minimal.
• Trade Consistency:
• 68% win rate overall
• Buy trades win 71.59%, sell trades 62.5%—suggests directional bias is well-handled.
• Recovery Factor (4.33): Shows resilience after losses.
 ️ Weaknesses or Areas to Watch
• Average Loss (-60.19) vs. Average Win (40.37):
You're losing more per losing trade than you're gaining per winner. This could be a red flag unless the win rate compensates—which it mostly does here.
• Largest Loss (-61.67) vs. Largest Win (85.22):
Not extreme, but worth monitoring. If losses spike, it could erode the edge.
• Z-Score (1.13, 73.73% confidence):
Indicates some statistical edge, but not overwhelming. Could be improved with more trade data or tighter entry logic.
🧠 Strategic Takeaways
Want help visualizing the equity curve or comparing this to another strategy? I can chart it out or run a deeper analysis.
 Streaks
on trade tab - trade closed by SL - check last trade profit (<0 = SL, >0 =BE if offset used) - print text. This should put the comment on chart where the trade closes.
you need to create a loop, that checks and link's into other loops. Try this, should work but unsure if it will select the correct position:
https://fxdreema.com/shared/difMA1pKc
The ZZ values are relatively easy to get, but are obtained via ZZ buffers, so another indicator will not be known. This contains lots from the ZZ indicator:
A lot is from mirros work
https://fxdreema.com/shared/tZtS4KoWd
Looking at this it looks like the stoc < and > will be true at the same time, I don't use this indicator, but maybe you need to use 2 conditions per tree... if < x.xx and > x.xx place trade, this will give you a window for placing a trade.
you need a reason why, is it the last low on the indicator... is there a buffer in the buffer window saying this candle?