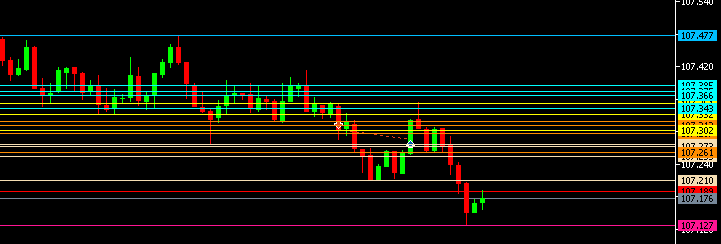
The BLUE line is my variable defined as "MAXIMA" it is adjusted whenever a candle breaks its value, so when a candle breaks it will adjust itself forming a new maximum, if the candle just touches it without pushing it remains in the price .
When a candle touches and pushes it will form a new maximum, when the candle finishes pushing this line and does not push anymore I want a number to be placed on top of it naming it.
F
Posts made by fabiobioware
-
RE: Mark with numbers the previous tops and bottoms on the graph ???posted in Questions & Answers
-
RE: Mark with numbers the previous tops and bottoms on the graph ???posted in Questions & Answers
@l-andorrà but, where am I going to put the sequence of numbers? I saw that it is a block of text, but if I configure exactly the way you said I will have nowhere to write the number, in reality I want that whenever a new top is identified an even number is placed on top of the candle that formed the top.
If a new fund is identified, an odd number is placed below the candle that formed the fund. -
RE: Mark with numbers the previous tops and bottoms on the graph ???posted in Questions & Answers
but, where am I going to put the sequence of numbers? I saw that it is a block of text, but if I configure exactly the way you said I will have nowhere to write the number, in reality I want that whenever a new top is identified an even number is placed on top of the candle that formed the top.
If a new fund is identified, an odd number is placed below the candle that formed the fund. -
Adjust values.posted in Questions & Answers
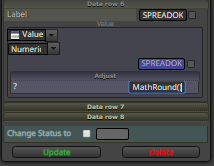
I would like the values that appear in my "Coment" block to be equal to the actual values of the price lines.
Note that where I defined "MINIMA" the value appears in the correct pattern, I want everyone to show the exact same values, how can I achieve this?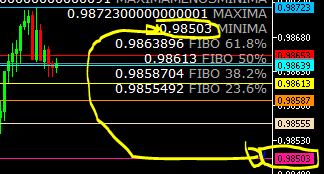
-
RE: Moving average levelsposted in Questions & Answers
@l-andorrà where do I find this "Trace" block?
-
RE: Moving average levelsposted in Questions & Answers
@trader-philipps @roar @miro1360 @l-andorrà
Can you help me? i'm trying to create the vegas tunnel EA here.
-
Spread Valueposted in Questions & Answers
I want to locate and record in real time in a variable to display the correct eurusd spread value on the screen
I tried to perform the procedure below but it didn't work.
Can you help me?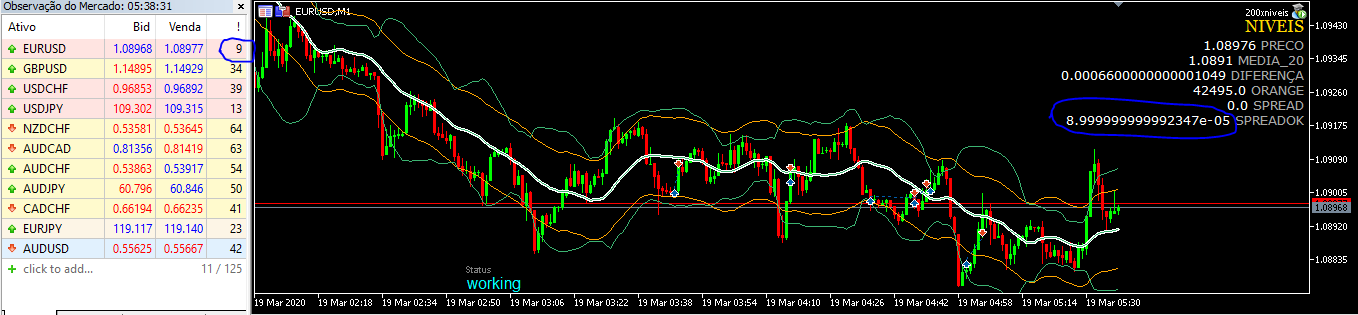
-
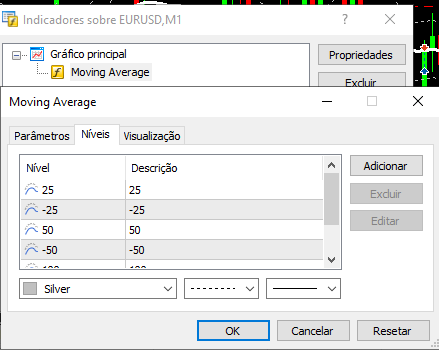
Moving average levelsposted in Questions & Answers
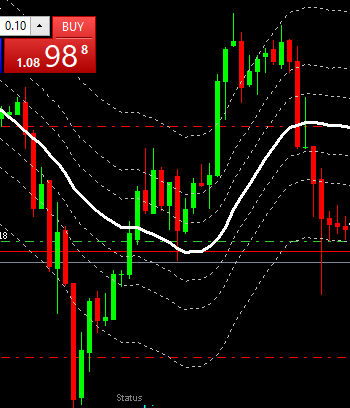
Hello friends, I want to know how to identify the levels that I created in my moving average, note that in the center I have a moving average and at the ends of it both above and below there are dotted lines, these are the levels.
I've already consulted the url http://fxdreema.com/forum/topic/4411/how-to-add-the-levels-in-moving-average-indicator-in-condition-block/5
But I didn't really understand how to do it, can someone give me an example?
-
RE: Mark with numbers the previous tops and bottoms on the graph ???posted in Questions & Answers
@miro1360 said in Mark with numbers the previous tops and bottoms on the graph ???:
zigzag, or envelopes could be less demanding
I am not able to understand how to set up a condition so that a number is plotted or write something on the tops or bottoms that the zigzag indicator finds, and the worst thing is that I am also not able to do something so that the numbers are in the sequences I want .
Can you help? -
RE: Mark with numbers the previous tops and bottoms on the graph ???posted in Questions & Answers
@l-andorrà said in Mark with numbers the previous tops and bottoms on the graph ???:
Not a trivial thing to do. Identifying tops and bottoms visually is one thing, but finding an algorithm doing that automatically is a completely different story. Would the zigzag indicator be useful in your case?
good idea, i will try, but and about print number on top and bottom automatically, you have suggestion, or example to share with me?
-
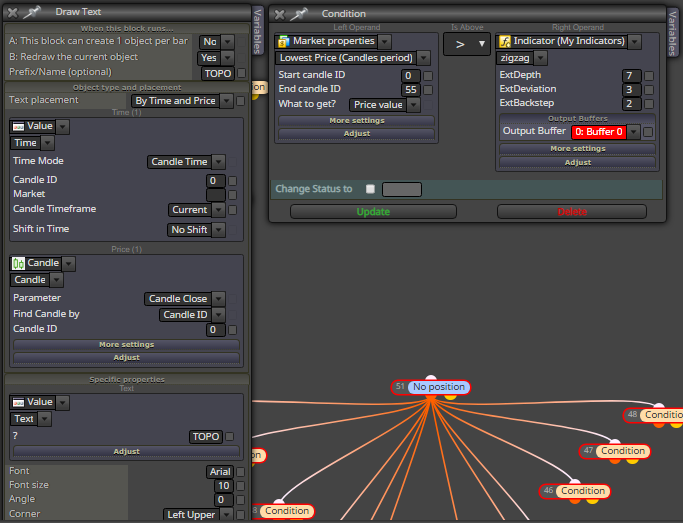
RE: Mark with numbers the previous tops and bottoms on the graph ???posted in Questions & Answers
I would like these numbers to be created automatically and randomly on the graph.
I would have to define a period for example:- Check the last 55 candles and check at random as follows:
Odd numbers following 1,3,5,7,9,11,13 should be displayed on the Tops.
Even numbers following 2,4,6,8,10,12,14 should be displayed in the Bottoms.
- Check the last 55 candles and check at random as follows:
-
RE: Mark with numbers the previous tops and bottoms on the graph ???posted in Questions & Answers
@miro1360, @l-andorrà, @trader-philipps Can you provide me with any help to achieve this goal?
-
RE: Printing lines on the chart in a personalized wayposted in Questions & Answers
@l-andorrà Hello friend, I finally got it disabled to redraw the graph and it's working 100%. Thank you for your help.
-
Mark with numbers the previous tops and bottoms on the graph ???posted in Questions & Answers
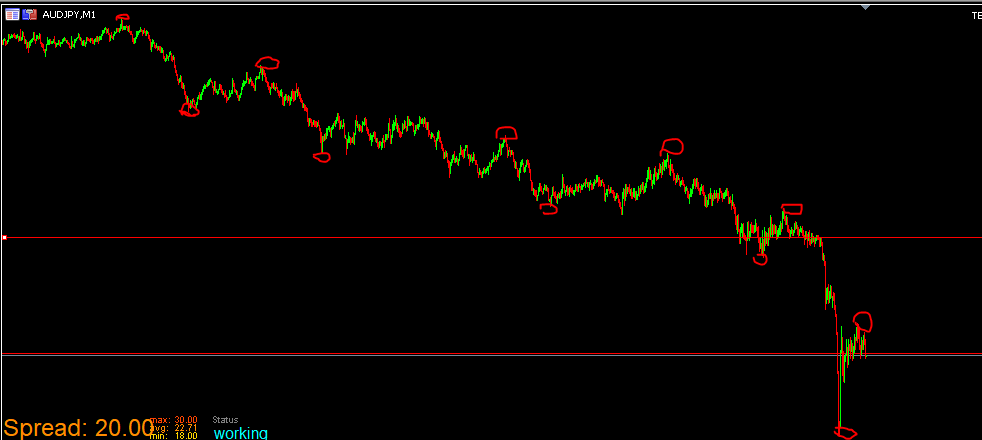
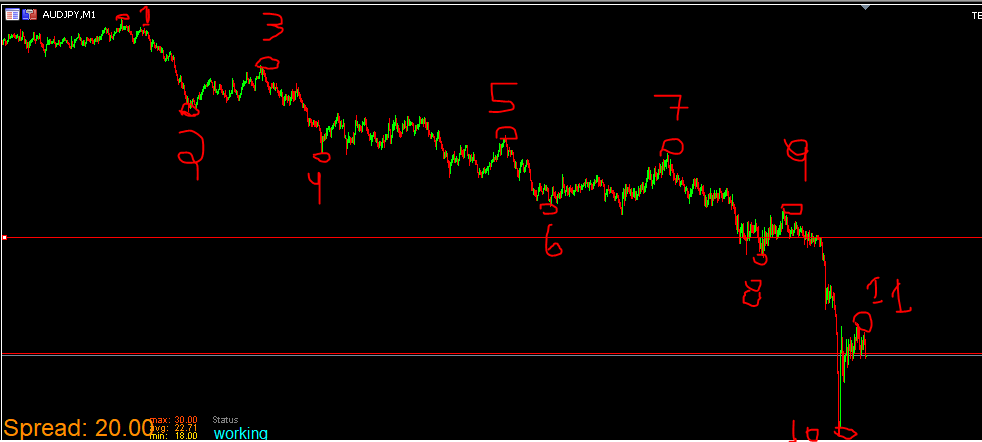
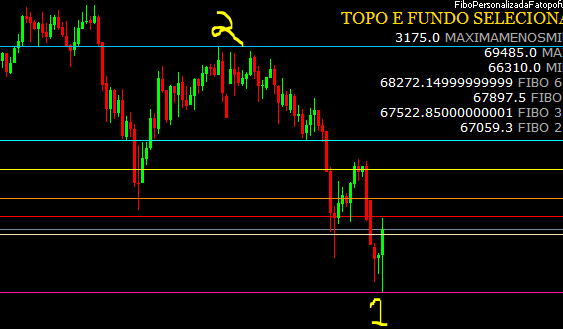
I would like to somehow identify what these tops and bottoms are and put some marking on them, it can be random numbers, 1,2,3,4,5,6
-
RE: Printing lines on the chart in a personalized wayposted in Questions & Answers
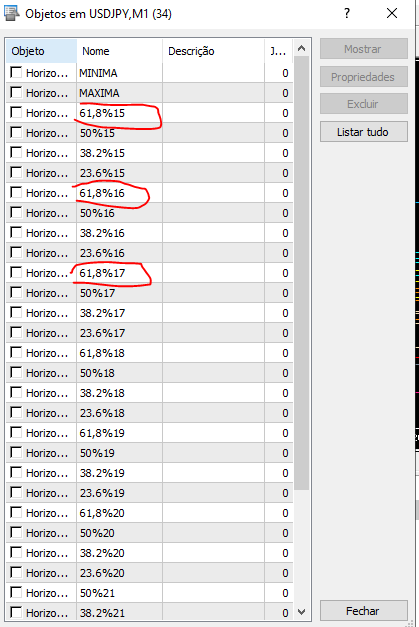
This Ea creates Fibonacci levels after I define a top or bottom by placing a horizontal line on the screen and renaming using "MAXIMA" to define a top or "Minima" to define a background.
As the price goes he is retracting these lines and changing the levels alone, this is right, what is not right is that he keeps replicating the lines and does not erase the previous lines, he can help me do it whenever I create new lines that does he delete the previous lines?
Notice in the images -
RE: Printing lines on the chart in a personalized wayposted in Questions & Answers
@l-andorrà said in Printing lines on the chart in a personalized way:
I don't understand those MAXIMA and MINIMA variables are for. Are you selecting them manually?
Yes, manually, but i want insert this automatic.
-
Printing lines on the chart in a personalized wayposted in Questions & Answers
I am having some difficulties and would like help.
-
I created a condition where tops and bottoms are checked within a period, and when checking the EA you should plot lines in the chart by demarcating these lines that I named MAXIMA and MINIMA, but when dragging the EA to the chart the lines are not being plotted .
I inserted a condition for these lines to be placed automatically whenever a new top and bottom were found. -
After these lines are printed, I would like them to always be updated, that is, that whenever a new top or bottom is formed, the line will adjust itself in the graph.
-
-
RE: Buy or Sell using buffers indicatorposted in Questions & Answers
@l-andorrà said in Buy or Sell using buffers indicator:
Try it in mq4. Indicator buffers work very differently on MT5
you have url to download this indicator for mt4?