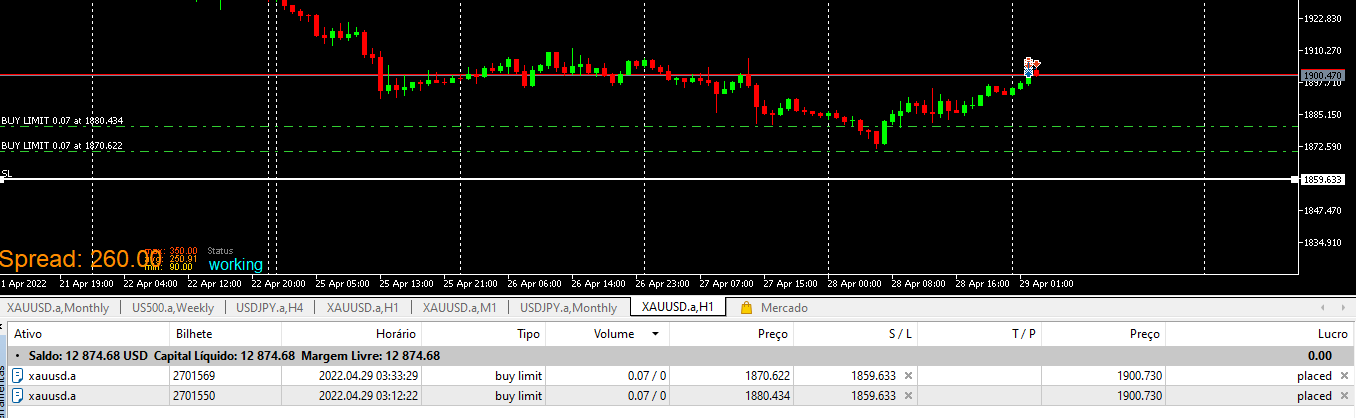
Hello friends, I know that some will say that there is already an indicator but in reality what I see is that most indicators are not delivering true data.
So I wanted to create my own calculation for this but I would like your idea.
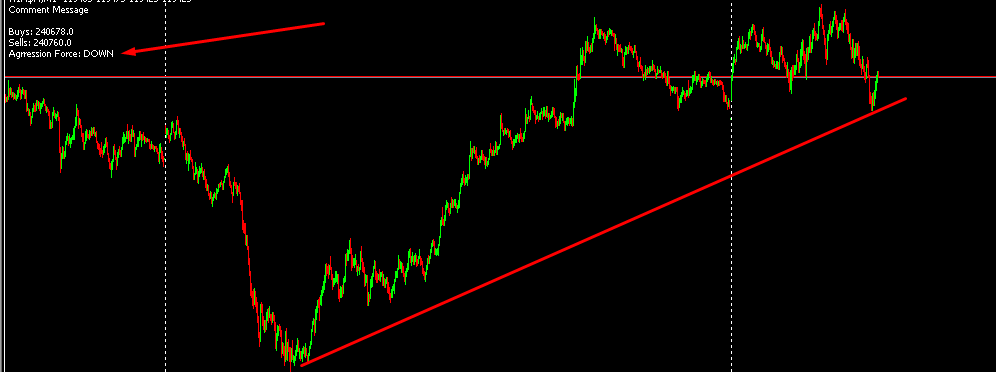
I would like to perform a tick count and separate this amount for sellers and buyers.
Can someone help me?
So let's use an example of investigating Candle (0-current)
1st part.
If the opening of the candle happened at the price 1000 and the bid price oscillated down by 1 point or 999, this (1) tick is a seller.
But if it fluctuated above 1001 then this (1) tick is a buy.
Any tips on how I can create this condition and separate it into variables?
2nd part.
After part 1, we can then continue adding this information for every new candle id 0 that appears and we will then be able to identify who is acting more strongly (buyers or sellers).
3rd part. Perhaps the most difficult.
Identify if in candle 0 there was some kind of very fast price variation, either for buying or selling.
If we are on the 1 minute timeframe, then let's say that as a rule most candlesticks have about 1000 ticks being (500 buyers and 500 sellers) but there happened to be 5000 ticks (4000 buyers and 1000 sellers) this could then be considered an aggression by buyers on the current candlestick.